
USER MANUAL for the
Spindle Check (SCA) 1.1 – Machine Tool Inspection
TABLE OF CONTENTS
- APPROVALS AND CONSIDERATIONS
- INTRODUCTION
- Fundamental Concepts
- Tests Performed by SpindleCheck
- Additional Capabilities of SpindleCheck
- STANDARDS AND REFERENCES
- ASSISTANCE
- SOFTWARE INSTALLATION
- SOFTWARE BASICS
- SpindleCheck Software
- Minimum Requirements
- Installation Procedure
- Select Mode of Operation
- Measure
- Load Data File
- SpindleCheck Software
- BASIC NAVIGATION 9
- Top Menu and Status Bar
- Top Menu
- Status Bar
- QUADRANT DISPLAYS
- Active Quadrant
- Notes Screen
- Maximizing Displays to Full Screen
- Minimizing Displays to a Quadrant
- SPINDLECHECK CONFIGURATION
- GENERAL CONFIGURATION
- CALIBRATION CONFIGURATION
- DIAGNOSTICS
- SpindleCheck Sensor Communication
- SPINDLECHECK HARDWARE
- Sensor System Electronics
- Probe Connections
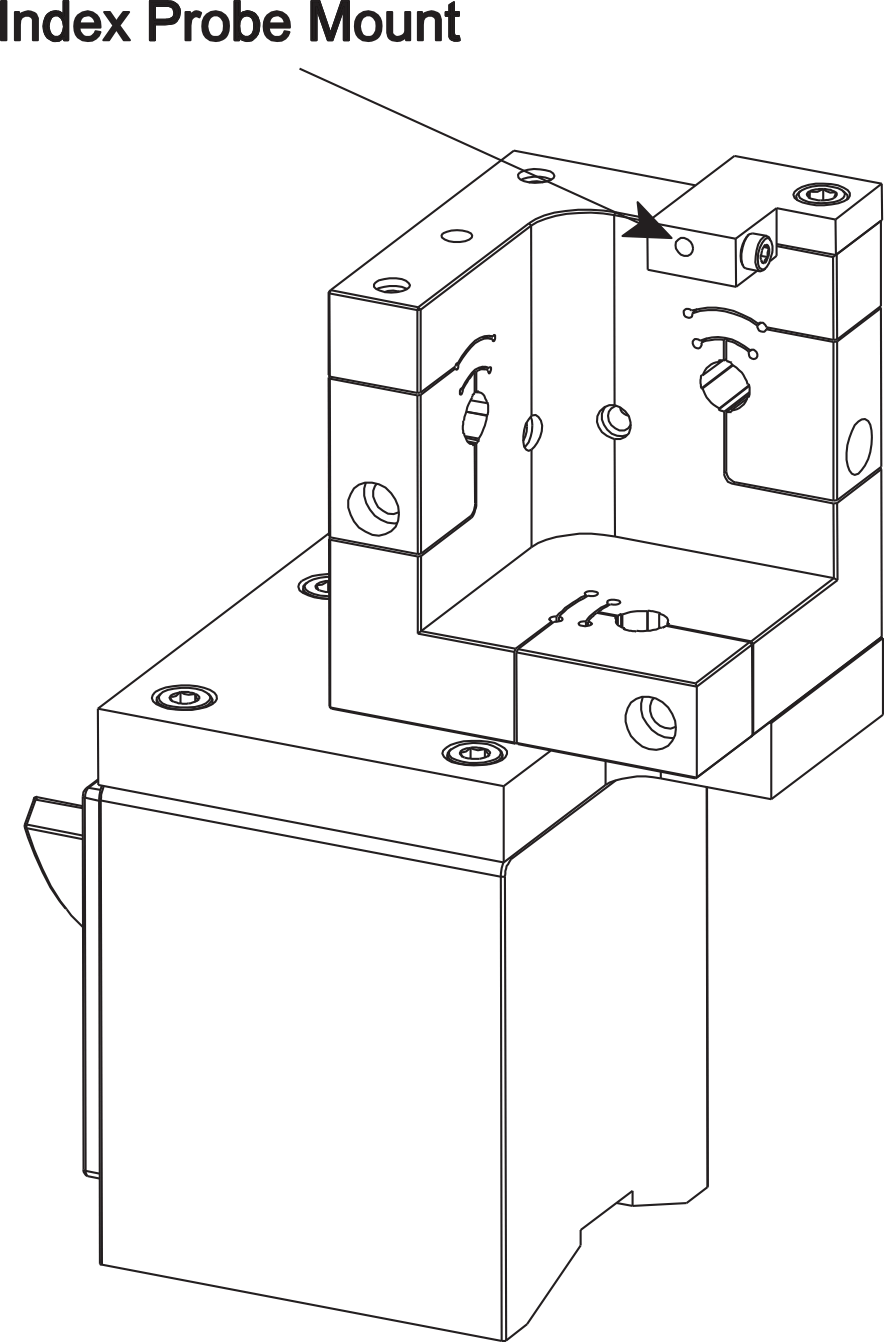
- Index Sensor (Purple)
- Signal Strength Indicator Conditions
- Capacitive Displacement Sensors (X, Y, Z)
- Capacitive Probes (X, Y, Z)
- Eddy Current Probe (Index)
- SENSOR SYSTEM PROBES
- Index Spacer
- Probe Nest
- Adapting Existing Probe Nests
- Precision Target Pin
- MEASURING MEASUREMENTS AND READING PLOTS
- Understanding and Interacting with Plots
- Adjusting Plot Displays
- Polar plots
- Understanding and Interacting with Plots
- SETUP FOR MAKING MEASUREMENTS
- Configuration
- Connection to PC
- Mounting Probes and Target Pins
- Care and Safety
- Mechanical Setup
- RUNNING TESTS
- Response Time and Screen Updates
- Basic Tests
- Radial: Rotating Sensitive Direction
- Radial: Fixed Sensitive Direction
- Axial Error Motion
- Thermal
- FFT Frequency Analysis
- Oscilloscope
- UTILITIES
- Probe Meter
- File Directory Structure
- SAVING RESULTS
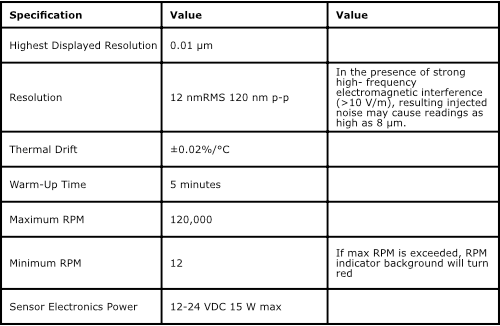
- SPECIFICATIONS
- APPENDICES
- Appendix A: Menu Item Descriptions
- Main Menu Bar
- Quadrant Menus
- Appendix B: Grounding Brush Installation
- Appendix C: Index Sensor Bracket Assembly
- Appendix D: Magnetic Base Installation
- Appendix E: Complete Magnetic Base Probe Nest Assembly (with Grounding Brush)
- Appendix F: Replacement Parts
- Appendix A: Menu Item Descriptions
- GLOSSARY
- SOFTWARE LICENSE AGREEMENT
APPROVALS AND CONSIDERATIONS
The SpindleCheck sensors and electronics are compliant with the following standards:
Safety: 61010-1
EMC: 61326-1, 61326-2-3
To maintain compliance with these standards, the following operating conditions must be maintained:
- All I/O connecting cables must be shielded and less than three meters in length
- Use the included CE approved power supply. If an alternative power supply is used, it must have equivalent CE certification and provide safety isolation from the mains according to IEC60950 or 61010.
- Sensors must not be attached to parts operating at hazardous voltages in excess of 33VRMS or 70VDC
Use of the equipment in any other manner may impair the safety and EMI protections of the equipment.
INTRODUCTION
The SpindleCheck is a hardware and software package for measuring the dynamic performance of machine tool spindles.
Fundamental Concepts
SpindleCheck uses noncontact, capacitive sensors to measure error motions as changes in position of a precision target pin installed and rotating in the machine spindle.
The pin includes a copper strip used to trigger a once-around index pulse. This index sets a reference for angular location of the spindle to align measurements from multiple rotations.
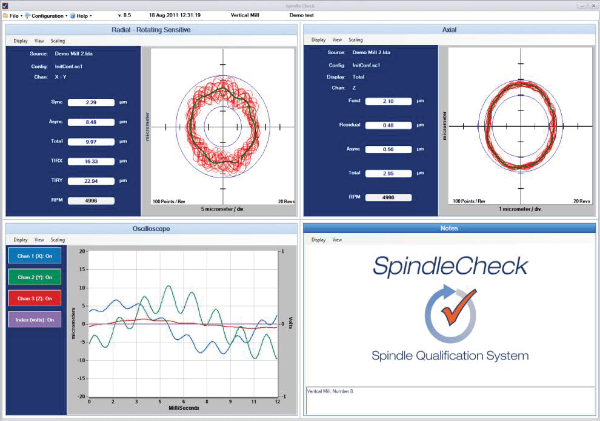
The measurements are collected and analyzed by the SpindleCheck software. The results of the live measurement or archived measurement file are presented on polar and linear plots with calculated values of standard error motion measurements.
Tests Performed by SpindleCheck
SpindleCheck performs the following tests as described in ISO, ANSI/ASME, and JIS standards:
- Radial rotating sensitive direction
- Radial fixed sensitive direction
- Axial error motion
- Thermal stability
- Temperature variation error
- FFT Analysis
Additional Capabilities of SpindleCheck
- Oscilloscope display
- Analog meter display
STANDARDS AND REFERENCES
ANSI/ASME Standard B5.54-2005, Methods for Performance Evaluation of CNC Machining Centers
- ANSI/ASME B5.57-2012, Methods for Performance Evaluation of CNC Turning Centers
- ANSI/ASME B89.3.4-2010, Axes of Rotation, Methods for specifying and testing
- ISO230 Part 3 (2001), Test Conditions for Metal Cutting Machine Tools, Evaluation
of Thermal Effects
- ISO230 Part 7 (2005), Geometric Accuracy of Axes of Rotation
- JIS B 6190-7, Test Code for Machine Tools Part 7, Geometric Accuracy of Axes of Rotation
ASSISTANCE
For assistance with the installation and operation of the SpindleCheck system, please visit our web site at: www.spindlecheck.com or contact us at:
SOFTWARE INSTALLATION
SpindleCheck Software
Minimum Requirements
- Windows 7 (32 or 64 bit), Windows 8
- 2 GB Ram; 1 GB Free Disk Space (minimum)
- 1 GHz Processor
- 1 Available USB port (2.0 or higher); 1024 x 768 Minimum Screen Resolution
Installation Procedure
The SpindleCheck program is installed in the \PROGRAM FILES (X86)\LION PRECISION\SPINDLECHECK directory on your hard disk. If you install the SpindleCheck software a second time using the same subdirectory, the previous installation will automatically be uninstalled first.
To use the SpindleCheck flash drive:
- Insert the Lion Precision SpindleCheck flash drive in an available USB port.
- View the contents of the flash drive.
- Run SpindleCheckInstall.exe
- Follow the directions of the installation programs.
- Once the installation has copied all files, restart the computer.
- After restarting, run the program by selecting the icon on the desktop, or by selecting Start > All Programs > SpindleCheck > SpindleCheck.exe.
The flash drive also contains demo data files and other valuable documents related to spindle measurement and improving machined part quality. These files are stored in the My Documents > Lion Precision > SpindleCheck > Docs.
SOFTWARE BASICS
Select Mode of Operation
When the program is launched (Start > SpindleCheck ), the initial splash screen requires you to choose an operating mode:
- Measure
- Load Data File
Measure
Select this option only if the SpindleCheck electronics are connected to the computer.
Load Data File
This mode only produces static displays of files loaded for viewing. It can be used for viewing and analysis of saved test data without the SpindleCheck electronics connected to the computer.
SpindleCheck can also view files from the Spindle Error Analyzer (SEA), but will only display the data available in SpindleCheck; it will not display data from channels 4 (X2) or 5 (Y2) or any of the tests not included in SpindleCheck.
The SpindleCheck electronics do not need to be connected to view saved data files.
BASIC NAVIGATION
The SpindleCheck software uses several simple conventions that make the software easy to use.
- Menus display lists of selectable options.
- Buttons execute functions or gain access to features.
- Panels display fields of information.
- In configuration windows, white background fields are inputs, while gray background fields are only indicators
Top Menu and Status Bar
Top Menu
File
Live Display: Connects to the SpindleCheck electronics and begins to collect measurements according to configuration parameters.
Load Data File: Loads saved rotational test data for display. Data files have .lda extensions.
Load Thermal File: Loads saved thermal test data for display in the thermal window. Thermal files have .lts extensions.
Save Data File: Saves the current rotational test data to a file. Thermal data is automatically saved while the thermal test is in progress.
Print Screen: Prints the current screen to a printer, PDF, or print preview. When printing, window backgrounds are changed to light gray for better printing results.
Exit: Exits the program
Configuration
Show Configuration: Displays configuration windows in all four quadrants. This will always display configuration windows in all four quadrants, even if a test window was previously selected for one of the quadrants.
Save Configuration: Saves the current configuration settings to the current file name. Save Configuration As: Saves the current configuration settings to a new file name. Load Configuration: Loads an existing configuration file.
Probe Meter: When connected to the electronics, the full screen Probe Meter is displayed. This is useful for probe placement during setup and for seeing low frequency machine structural movements when the spindle is not rotating.
Return to Test Displays: Returns test displays to all four quadrants. This selection will always display test windows in all four quadrants, even if a configuration window had been previously displayed in one of the test quadrants.
Help
Manual: Opens a PDF view of this manual.
Typical Mounting: Displays an image of a typical setup.
Lion Support: Contact information and online resources for support in operating SpindleCheck.
About: Revision level and other information about the software.
Status Bar
The Status Bar is to the right of the Top Menu. It contains information about the data currently being viewed. That data will be different for viewing data from a file compared to viewing live data streaming from the SpindleCheck sensor electronics.
Run/Pause: This button is only visible when the electronics are connected, AND the index probe is detecting rotation. SpindleCheck defaults to Run mode when a rotation is detected and the button will display “Pause.”
Clicking Pause will immediately freeze the screen with the last 32 revolutions of data and change the Status Bar color to yellow. This mode can be used for closer examination of the data and for saving a data file. When Paused, the button will change to “Run.” Clicking Run resumes the process of collecting measurement data from the device and displaying it.
Version (v.): The current version of the SpindleCheck software. When viewing a file, the Version field displays the version of software in use when the data was collected.
Date/Time: Displays the current date and time while displaying live data. Displays the date and time the data was collected when viewing a file.
Machine ID: Displays the current text in the Machine ID field of the General Configuration panel.
Operator Name: Displays the current text in the Operator Name field of the General Configuration panel.
Status Bar Color
The Status Bar background color indicates the overall system status.
Green: Computer is connected and communicating with the sensor electronics.
Yellow: Computer is connected and communicating but it is “Paused.”
Orange: Probe Meter is displayed full screen and no other measurement data is being collected.
Red: Error mode. Either communication with the sensor electronics has been interrupted (check connections and power) or there has been a program error.
White: Viewing files or otherwise idle.
QUADRANT DISPLAYS
SpindleCheck displays four quadrants on your screen. Each quadrant displays a selected view of the current data or configuration information. The current data may be live data from the sensors or saved data from a previous measurement.
Each quadrant has a menu bar (Quadrant Menu) which begins with Display. Use the Display menu to select which panel to display in that quadrant. If a selected panel is already being displayed in a different quadrant, that panel will move to the selected quadrant and the display’s previous quadrant will be replaced with a Notes screen.
Active Quadrant
Some functions like keyboard shortcuts execute functions in the “active” quadrant which has a darker title bar. Quadrants are activated by clicking anywhere in the quadrant.
Notes Screen
Screen-prints are often used to document spindle tests. It is helpful to have machine information displayed on the screen when the screen is printed.
To display a Notes quadrant, select Display > Notes in a quadrant.
Click in the text box to enter text. To change the displayed image, select View > Select
Graphic from the Notes screen’s tool bar.
Maximizing Displays to Full Screen
Initially, each display uses one quarter of the screen (quadrant). Select View > Maximum Size to fill the entire screen, or double click the right mouse button over the display to be maximized.
Minimizing Displays to a Quadrant
Select View > Normal Size to return a maximized display to its quadrant, or double click the right mouse button over the display.
SPINDLECHECK CONFIGURATION
SpindleCheck software must be properly configured for proper operation.
Most of the required configuration information is correct as the default values when SpindleCheck is installed. The only exception may be the Target data. The default values are for the 20 mm precision target pin. If you are using a different target, you will need to change the values for target configuration. Also, the target’s serial number will have to be added to the configuration if you want that number tracked in the data files.
The complete configuration consists of data from four different configuration windows. Access the configuration windows through Main Menu > Configuration > Show Configuration to display all configuration windows, or in any individual quadrant select Quadrant Menu > Display > Configuration > [Selected Configuration Window].
When connected a SpindleCheck electronics, these windows display the current measurement configurations and can be edited.
When viewing a file, these windows display the configuration information contained in the file being viewed and cannot be edited.
There are different types of configuration information:
Indicators: These read-only fields display information acquired from the system or calculated from other fields. They have a lightly shaded background.

Inputs: These may be required or optional input settings that must be manually entered by the user. Inputs have a white background.

Configuration settings can be saved with Configuration > Save Configuration in the main menu bar.
GENERAL CONFIGURATION

CALIBRATION CONFIGURATION
During live measurements, the calibration configuration window displays calibration details of the SpindleCheck device currently connected. When viewing a file, it displays the calibration details of the system used when the file was created.
Calibration information is given for three capacitive channels (X, Y, Z). For SEA files with more than three channels, only X, Y, Z will be shown.

DIAGNOSTICS
The Diagnostics window shows current measurement and diagnostic information coming from the SpindleCheck device. The Diagnostics window will display some values when files are being viewed, but is only useful during live measurements.

SpindleCheck Sensor Communication
This window offers information regarding the communication between the PC and device electronics. Lion Precision support may require some of this information during troubleshooting should there be a communication problem. This information is not generally useful for normal operation.
SPINDLECHECK HARDWARE
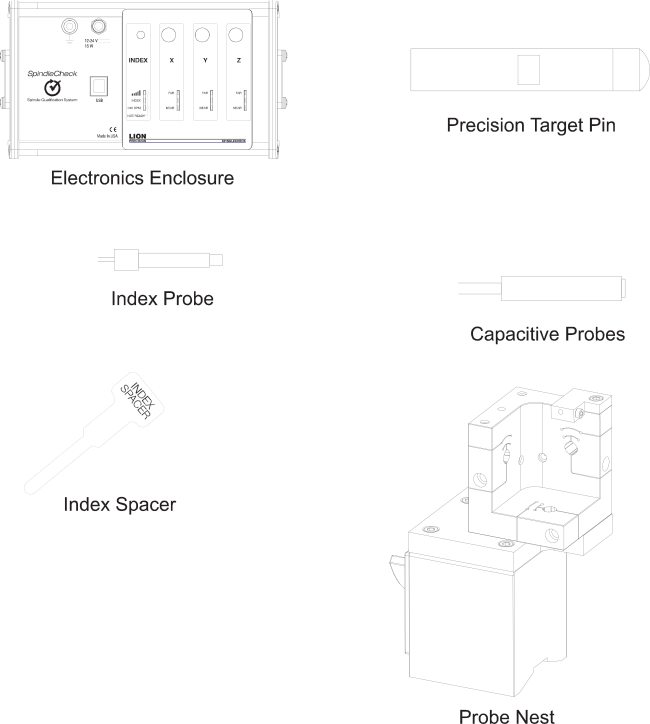
Sensor System Electronics
The sensor system electronics include driver electronics for the capacitive and index probes, USB port for communicating with the PC, power and ground connections, and indicators useful during setup.
The electronics enclosure has a magnetic base.
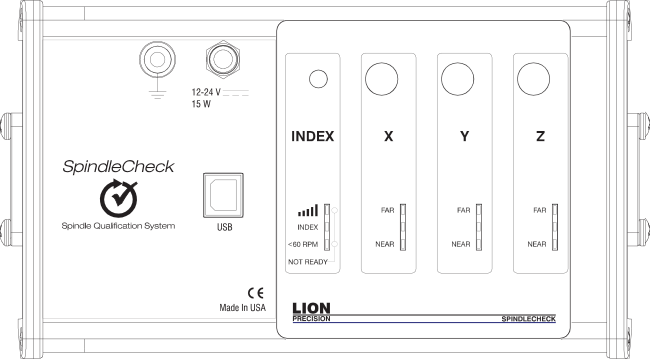
Probe Connections
The Index sensor channel and X, Y, and Z capacitive displacement sensor channels are color coded. The colored blocks of each channel must match the color-coded rings on each probe.
Calibration stickers for each capacitive sensor channel (X, Y, Z) are located on the back of the device. These indicate probe serial numbers and their association with particular channels.
Index Sensor (Purple)

An index pulse is used to detect rotation. This signal is also used to align readings from multiple revolutions. The Index sensor uses an eddy current probe to detect the copper plating on the target pins. Alternatively, a piece of copper tape can be used if using a target without the copper plating.
The indicator lights provide feedback regarding the index function.
 Signal Strength
The Index probe senses a difference between the copper and steel on the target. When the spindle is rotating, the resulting AC signal is used to time the measurements of the rotating spindle. The AC signal must be sufficiently large to ensure reliable triggers to the system.
The closer the probe is to the target, the greater the signal strength, but the probe must maintain a safe distance from the rotating target to avoid contact. The INDEX SPACER is provided to set the ideal gap in most circumstances.
Signal Strength Indicator Conditions
- Green: Good signal strength
- Red: Poor signal strength or no rotation
INDEX
This indicator lights Green when the Index probe is reading the copper strip and is Off when the Index probe is over the steel.
< 60 RPM
This indicator is Green when the system detects less than 60 RPM and enters “slow” mode. This requires no action on the operator’s part, but can be informative for troubleshooting. This indicator can take as long as a few minutes to update when speed slows from above 60 RPM to below 60 RPM.
NOT READY
The top and bottom indicators light Blue during the 60-90 second initialization period when power is applied to the SpindleCheck electronics. No communication between the computer and device is possible during this time.
Capacitive Displacement Sensors (X, Y, Z)

The X, Y, and Z Axes each have a separate color-coded capacitive displacement sensor channel.
X: Blue (Channel 1 on calibration sheet)
Y: Green (Channel 2 on calibration sheet)
Z: Red (Channel 3 on calibration sheet)
Indicator lights are Green when the probe is within its calibrated range.
The Near or Far light will be Red when the probe is outside of its calibrated range.
The Near and Far lights will be Blue when the capacitive probe is not connected.
SENSOR SYSTEM PROBES
The system includes four probes: one eddy-current Index probe, and three capacitive displacement probes for X-, Y-, and Z-Axes.
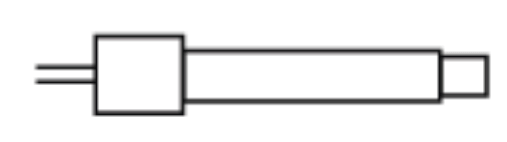
Capacitive Probes (X, Y, Z)
Noncontact capacitive probes measure the precision target pin as it turns. The probes are 8 mm in diameter, have a total measurment range of 250 μm, and a minimum gap (Near Gap) of 125 μm.
Calibration sheets and calibration stickers on the back of the electronics housing will list the specifics of the calibrations. If capacitive probes are damaged, the electronics and probes must be returned to the factory for probe replacement and recalibration.
 Eddy Current Probe (Index)
The eddy-current Index probe provides a once-around signal to align data for multiple rotations. Its nominal distance from the target is 0.5 mm (0.02 inch). The tip is ceramic.
Use caution to prevent damage. Replacement probes are available: Part Number P015-4657.
 Index Spacer
The Index Spacer is 0.5 mm (0.02 inch) thick and is used to set the gap between the Index probe and copper plated portion of the precision target pin.
Replacement Part Number A017-7560.
Probe Nest
The probe nest includes mounting for X, Y, Z probes and an Index probe. An optional grounding brush (P017-6152) is available. Instructions for grounding brush installation are in Appendix B.
Adapting Existing Probe Nests
If you have an existing probe nest and want to adapt it to SpindleCheck, you will need to add an Index Probe Bracket (P017-6157). See Appendix C. You can also add a magnetic base (P017-6117), see Appendix D.
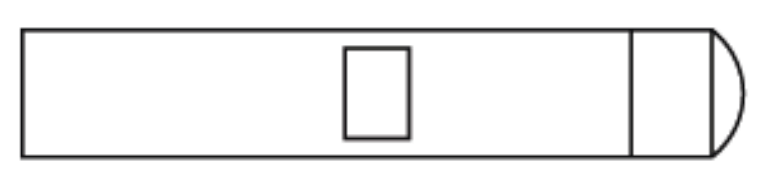
Precision Target Pin
A precision 20 mm gage pin is used as a target for measurements. The pin has a precision 1 inch (25.4 mm) diameter spherical end for Z-Axis measurements and a precision ground surface for measurements in the X and Y directions. The pin includes a copper plated area which is sensed by the Index probe.
The precision-ground surfaces are important for accurate measurements. If these surfaces are damaged, the pin should be refinished by Lion Precision to restore an accurate reference surface. Or a new pin can be purchased: Part Number P017-6091.
MEASURING MEASUREMENTS AND READING PLOTS
Understanding and Interacting with Plots
Adjusting Plot Displays
Scaling
Use the Scaling menu to select Auto or Manual scaling. Auto scaling adjusts to provide the best view of the existing data. Select Scaling > Manual > Increase or Decrease, or use Page Up and Page Down keys to adjust scaling manually.
Polar plots
Polar plots chart measurements at successive angular locations of the spindle. The plots show the last series of 32 revolutions. The plot will update every time a new series of 32 revolutions is completed; hence, the rotational speed of the spindle will determine the time between plot updates.
The plot scale is listed at the bottom of the plot.
The center of the plot does not represent zero when the axes do not cross (see example).
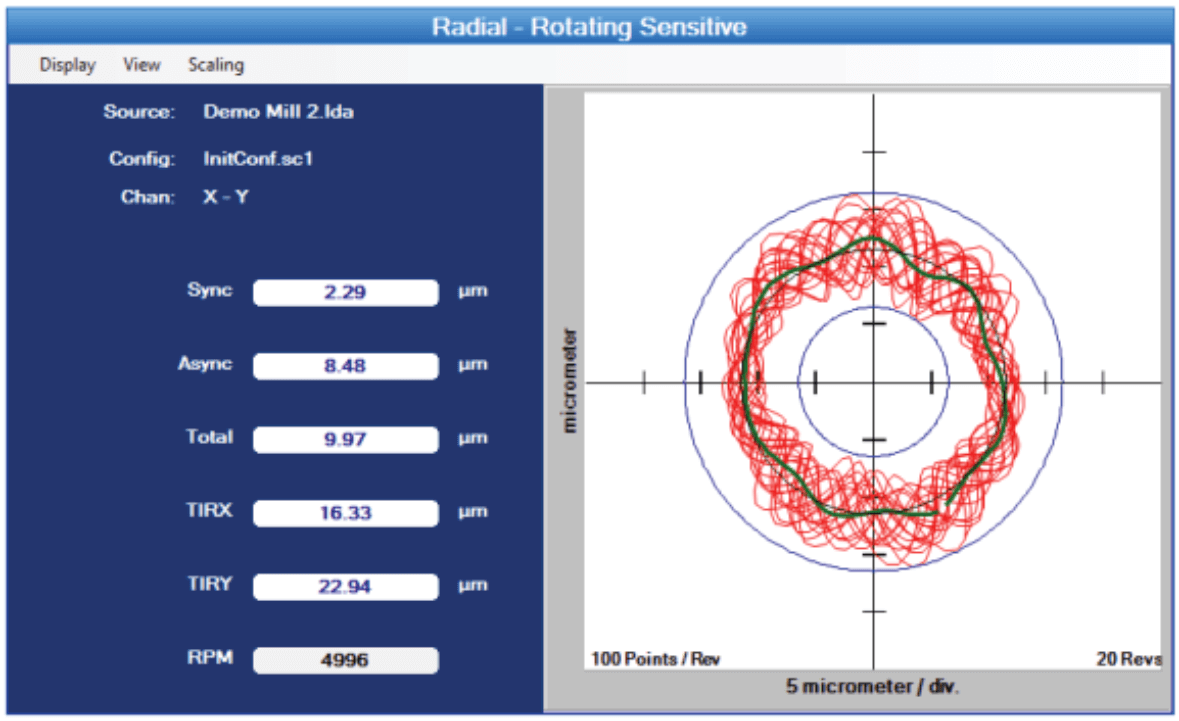
This allows sufficient display resolution of small spindle motions, which may be off- screen if the center were zero.
Calculated values are to the left of the plot. Definitions of the calculated values are in the glossary in this manual and in Help.
Calculated Plots
In addition to plots of individual data points, calculated plots are superimposed on the data plots to assist in measuring and viewing some important values calculated according to international standards.
Total – Two blue circles. The origins of the circles are at the center of the plot. The inner circle is the largest diameter possible inside the 32 revolution data points (maximum inscribed circle). The outer circle is the smallest diameter possible outside the data points (minimum circumscribed circle). The distance between the circumferences of these circles is the total error motion.
Average – This green plot is generated by placing a single data point at each angular location. The magnitude of the point is equal to the average of the measurements of the 32 points acquired at that angular location.
To find the center of polar plot data, SpindleCheck uses the MLS (Modified Least Squares) method describe in A Few Methods for Fitting Circles to Data by Umback and Jones (IEEE Transactions on Instrumentation and Measurement, V52, I6, December 2003).
SETUP FOR MAKING MEASUREMENTS
Configuration
The SpindleCheck software must be properly configured. Much of the configuration information is downloaded directly from the sensor system electronics.
Some configuration information must be entered by the user. This information must be properly entered for accurate measurements.
See the Configuration section of this manual for details (p. xii).
Connection to PC
Connect power to the SpindleCheck device. The SpindleCheck device will take 60-90 seconds to initialize during which time the “NOT READY” indication (two blue lights) will be displayed on the INDEX channel.
Connect the USB cable to a USB V2.0 or higher port on the computer (USB V1.0 does not have sufficient transfer speed).
While not necessary, it is best for the SpindleCheck sensor electronics to be “Ready” when the software is launched. If the operator selects a Measure mode when the software starts, the software will repeatedly attempt to communicate with the sensor electronics. If the electronics are not ready or the USB cable is not connected within 5 minutes, the software will display an error dialog allowing the operator to power up the electronics and connect to the computer and Retry or Quit.
Mounting Probes and Target Pins
Care and Safety
The precision target pin has a maximum rotational speed of 120,000 RPM. High-speed rotation can create substantial energy. Care must be taken to protect operators when rotating parts at high speeds. Guarding is recommended. Positioning the probe nest such that it is between the operator and the spinning target will provide some degree of protection.
The target pins are high precision components that require special care similar to gauge blocks.
For detailed information, please consult TechNote LT03-0013 Probe Mounts and Master Targets: Dimensions, Care, and Adjustment available in the Technical Library at www.lionprecision.com.
Mechanical Setup
There are five goals in the mechanical setup:
- Probes never make contact with target during rotation (incidental contact during setup while the spindle is stationary is safe)
- Target pin axis is aligned with Z probe axis (pin’s spherical end is centered on the probe)
- Probes are adjusted to the center of their measurement ranges
- Probes stay in range during the full rotation of the spindle
- Index probe is properly spaced from the copper target area of the pin
Target Pin Installation
Target pins (20 mm diameter) are installed in the tool/part holder of the spindle to be tested.
Axis/Channel Relationships
Each probe channel is color coded for a specific input. Probes have colored collars at both ends and the electronics channels are marked with color blocks. The X axis is blue, Y axis is green, Z axis is red, the Index input is purple.
Measure-Ready Probe Nest Configuration
Once the individual probes are positioned in the nest according to the instructions below, they can be left in position in the probe nest when stored in the case. When removed from the case for the next measurement, the relative position of the probes should remain the same. Because of the fragile nature of the Index probe, it is recommended that it be repositioned with the Index Spacer tool every time the system is used.
Position Probes in the Probe Nest
Loosen the probe clamp screws if necessary and install the probes in the nest. Tighten the probe clamps slightly such that the probes are held in place but can still be repositioned by hand (do not pull on probe cables).
Mount the probe nest such that the rotating target can be moved into range of the probes in the nest. It is critical to firmly clamp the probe nest to the machine tool table. The probe nest base surface and the mating surface must be clean so the nest is not skewed or allowed to shift, rock, or vibrate while measurements are taken.
Positioning Spindle/Targets and Probes
The Z axis probe must be centered on the spherical end of the pin. The center is located and positioned by using the Z probe and Probe Meter to find the high-spot as the target is repositioned in front of the probe. Center the target on the probe with a process such as this:
Capacitive Sensors Initial setup
1. In the Main Menu, select Configuration > Probe Meter.
2. The Probe Meter will open full screen.
3. Move the X-, Y-, and Z-axis probes to a retracted position in the probe nest to prevent collision with the target when it is moved into approximate position.
4. Move the X-and Y-axes to position the target in the probe nest visually centered on the Z-axis probe.
5. Next, move the Z-axis to approximately center the target area (shiny surface) on the X- and Y-axis probes.
This should also place the Index probe in line with the center of the copper area.
Z-axis centering of target pin
6. Select the Z-axis channel on the Probe Meter.
7. Move the Z-axis probe in the probe nest toward the pin until the Near/Far indicator on the electronics is in the center position. Do not fully tighten.
8. While observing the Probe Meter, adjust the machine X-axis position until the high- spot (maximum positive indication) is indicated on the Probe Meter.
9. While observing the Probe Meter, adjust the machine Y-axis position until the high- spot (maximum positive indication) is indicated on the Probe Meter.
10. If the Probe Meter goes to its maximum reading during step 8 or 9, stop at the maximum point and readjust the Z-axis probe position to near “0” on the meter and continue finding the “high-spot.”
11. The target is now centered over the Z-axis probe.
12. Readjust the Z-axis probe in the probe nest to near “0” on the Probe Meter (center light on Near/Far indicator on electronics).
13. Tighten Z-Axis probe firmly.
X-axis and Y-axis probe position
14. Select the X-axis on the Probe Meter
15. Adjust the X-axis probe in the probe nest to near “0” on the Probe Meter (center light on Near/Far indicator on electronics).
16. Tighten the X-axis probe firmly.
17. Repeat steps 14-16 for the Y-axis probe.
Probe Range Check
Once X, Y, and Z capacitive probes are positioned, slowly rotate the spindle by hand one full rotation to be sure all probes stay in their calibrated measurement range (no red Near or Far lights on electronics).
Setting Index Probe Position
The Index probe is a critical part of the measurement. The goal of the setup is to set the proper gap between the probe and copper area on the target to ensure sufficient signal strength is generated by the change between the copper and the steel target.
See the Index Channel (Purple) (p. xviii ) section of this manual for details about the indicator lights.
 Index Probe Positioning Procedure
1. Place the “INDEX SPACER” between the Index probe and the copper plated portion of the target.
2. Position the Index probe against the INDEX SPACER. This sets a gap of 0.5 mm (0.02″) between the probe and target and tighten Index Probe set screw – DO NOT OVER TIGHTEN.
3. Remove INDEX SPACER.
4. Rotate the target slowly and verify signal strength indicator on the Index channel lights green. If it is red, use the INDEX SPACER to verify the gap and retry. If still Red, the gap will need to be reduced, but be careful not to allow contact between the probe and target when rotating.
CAUTION: The Index Probe can be damaged by over tightening the set screw that secures it in place. DO NOT OVER TIGHTEN
RUNNING TESTS
To view live test data while a spindle is being measured, select File > Live Display from the SpindleCheck main menu bar.
To view data from saved measurement data, select File > Load Data File.
Response Time and Screen Updates
SpindleCheck electronics’ internal data acquisition system acquires measurements from 32 revolutions of the spindle before data is transferred to the software. The on-screen displays only update every 32 revolutions. When a change in RPM is detected, SpindleCheck electronics discards the current set of revolutions being collected and restarts the collection of 32 revolutions at the new speed.
SpindleCheck can test spindle performance in rotary tables as well. Measuring at speeds below 60 RPM requires “Slow” mode. A light on the Index channel indicates when slow mode is operating. Changing from normal to slow mode may take several minutes.
When a change in speed crosses below the 60 RPM threshold, the slow mode is automatically triggered requiring a confirmation of spindle speed, discard of current data, restart of the data collection process, and collection of 32 revolutions.
All of these actions can take up to two minutes. During this time, the software is not receiving data from the sensors and the screen is not updating. Please allow time for the process to complete before expecting to see changes in the data presented on the screen.
In Slow mode (below 60 RPM) 32 revolutions can take considerable time. While 32 revolutions of data are being collected, the software is simply waiting for updated data and the displays will not change.
Basic Tests
Reading and interacting with the test plots and panels in general is covered above. The following sections give specific, unique information about the specific tests.
Radial: Rotating Sensitive Direction
![]()
X and Y axis measurements are used to create a polar plot. Used to measure machines which turn a cutting tool like machining centers and boring machines.
Radial: Fixed Sensitive Direction
![]()
X or Y axis measurements are acquired and presented in a polar plot. Used for turning centers and grinders.
Axial Error Motion
![]()
Measures spindle motions in the Z-axis.
Error motions at the rotational frequency of the spindle (fundamental frequency) are removed from the data before plotting to the polar plot. Magnitude of the fundamental frequency is listed in the calculated values.
Thermal
![]()
The two thermal tests listed in international standards are ETVE (Environmental Temperature Variation Error) which is performed while the spindle is stationary, and Thermal Drift which is measured when the spindle is rotating. The display and operation of the panel remains the same for both tests. Only the time of the test, the channels used, and the rotation of the spindle are changed.
Setup
The thermal test setup parameters are accessed by clicking Setup on the Thermal Quadrant menu bar.
In the Setup dialog box:
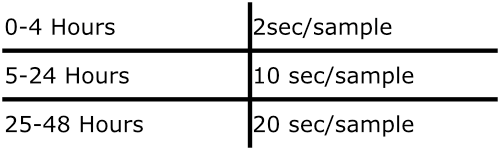
▪ Set test duration (Hours, Minutes).
Sampling frequency is dependent on the test duration:
▪ Save Bitmap, when checked will save a bitmap (.bmp) of the chart when the time expires. The bitmap will have the same name as the Test File but have a .bmp extension.
▪ Use Save File Location to select a file name for data storage. If the field is left blank, the Thermal test will not run.
Initial Graph Time Base
When the test is first started, the time axis (x axis) of the graph will show five minutes for the entire graph. This allows higher time resolution for visually monitoring the output of the channels early in the test. After five minutes, the time axis will rescale to the selected time for the test.
Channel Select Buttons/Displays
Data is always collected from all three channels during the test.
Clicking X, Y, and Z buttons enables/disables the display of that channel on the chart. The chart plots are color coded to the probes and electronics.
The value displayed on the buttons is the Range of measurements taken (max-min) for that channel during the test.
Viewing Thermal Files
Thermal data files are separate from rotating data files. Thermal data files are automatically saved with the filename assigned during setup.
Thermal data files are loaded in the Main Menu bar, File > Load Thermal File, or in the Thermal quadrant, View > Load File.
FFT Frequency Analysis

Used to analyze frequency distributions in error motions. The FFT analysis test shows the amount of motion at different frequencies with a graph of amplitude vs. frequency. Seeing the frequency distribution of error motions can help determine the source of a problem. The graph is updated with each new block of 32 revolutions. The FFT size is 8K (8,192 samples).
FFT Views (from View menu):
Bar Graph – Bar (column) graph display
Line Graph – Continuous line connecting measurements
Window(from View menu):
Selects the type of mathematical windowing technique for displaying the FFT. Hanning or Rectangular are typical choices.
Scaling
Scaling and axis units are available in the Scaling menu. Cursor
A cursor (View > Show Cursor Values) can be used display discrete values at any point on the chart. The cursor is a small circle at the intersection of purple vertical and horizontal guide lines. Click and drag the cursor to reposition it.
UTILITIES
Oscilloscope
The Oscilloscope is a utility display that emulates a basic oscilloscope allowing a time based view of the data acquired on any of the four probe channels. This is a useful display to check basic functionality of the input channels when troubleshooting.
Channel Select Buttons/Displays
Clicking X, Y, Z, and Index Gap buttons enables/disables the display of that channel on the scope. The scope plots are color coded to the probes and electronics.
Scaling
Vertical (displacement) and horizontal (time base) scaling is automatic by default. Manual adjustments are made under the Scaling menu or with these keyboard shortcuts:
Enter: Rescale Vertical
End: Automatic Vertical Scaling
Pg Up: Increase Vertical
Pg Dn: Decrease Vertical F7: Increase Time base F8: Decrease Time base
Coupling
Use the View menu to select DC or AC Coupling.
Probe Meter
The Probe Meter is a full screen analog meter indicating the current probe/target gap of the selected probe.
Access the Probe Meter through the Main Menu: Configuration > Probe Meter
X, Y, or Z channel can be displayed. Use the mouse or the up or down keyboard arrows
to select a different channel.
Maximum and minimum indicators retain the maximum and minimum positions of the meter needle (total indicator reading). These values are shown digitally below the meter. Click the Reset TIR button to reset the maximum and minimum indicators to the current meter indication.
The Probe Meter display is useful not only for setup, but for checking the static vibration motions of the spindle relative to the table when the spindle is not turning. Vibration from adjacent machines or other environmental factors can be revealed in this view.
SAVING RESULTS
To save the current data, select File > Save Data File. Use the Save Dialog to select the
file name and location.
File Directory Structure
Critical files for SpindleCheck must be located in appropriate subdirectories. These files are placed in the correct locations during the installation process. This structure is provided in case new files need to be added or to assist in troubleshooting.
C:\Program Files(x86)\ Lion Precision\SpindleCheck
Contains all program files
C:\ProgramData\LionPrecision\ SpindleCheck \Data
Contains sample data, default configuration files, and other support documents.
C:\Users\user name\My Documents\Lion Precision\SpindleCheck
The first time SpindleCheck runs for a new user, this folder is created if it does not exist. The default files are copied to this new location.
All Help files
SpindleCheck Manual
Related documents and text files
Default directory for data files. User can save data files to any location.
All data file samples
SPECIFICATIONS
Appendix A: Menu Item Descriptions
Main Menu Bar
File
Live Display: Connects to the SpindleCheck device and begins to collect measurements according to configuration parameters.
Load Data File: Loads a previously saved rotational test data file for display and review Load
Thermal File: Loads a previously saved thermal test data for display and review in the thermal window
Save Data File: Saves the current rotational test data to a file (Thermal files are saved automatically in a filename specified during thermal test setup)
Print Screen: Prints the current screen to a printer, PDF, or print preview. When printing, window backgrounds are changed to light gray for better printing results.
Exit: Exits the program
Configuration
Show Configuration: Displays configuration windows in all four quadrants. This menu selection will always display configuration windows in all four quadrants, even if a test window were previously selected for one of the quadrants.
Save Configuration: Saves the current configuration settings to the current file name.
Save Configuration As: Saves the current configuration settings to a new file name.
Load Configuration: Loads an existing configuration file.
Probe Meter: Full screen analog meter for aiding initial probe positioning.
Return to Test Displays: Returns test displays to all four quadrants. This selection will always display test windows in all four quadrants, even if a configuration window had been previously displayed in one of the quadrants.
Help
Manual: Opens a PDF view of this manual
Typical Mounting: Displays an image of a typical probe/nest/target setup.
Lion Precision Support: Contact information and online resources for support in operating SpindleCheck
About: Revision level and other information about the software.
Quadrant Menus
Quadrant menus will contain different options depending on quadrant content. All possible menu items are listed below, but they will not all appear on every quadrant.
Display
Lists all possible quadrant displays. All Test and Configuration displays can be accessed through this menu. Whether the quadrant is currently a Test or Configuration display changes the groupings in this menu.
View
View > Maximum Size enlarges a quadrant panel to full screen.
View > Normal Size reduces a full-screen panel to a quadrant.
View > Display > Polar/Linear selects the style of the plot
View > Channel provides a selection of channels or channel combinations available for that test.
View > Coupling selects AC or DC coupling for the oscilloscope.
Scaling
Keyboard shortcuts execute functions in the “active” quadrant which has a darker title bar. Quadrants are activated by clicking anywhere in the quadrant.
Scaling > Rescale [Enter] when in manual scaling mode scales the current data to fit the plot area.
Scaling > Auto [End] monitors the data and changes the scale so that the data is always within 40% to 90% of the scale. Auto-scaling can also be activated by clicking the END key while the quadrant is active.
Scaling > Manual > Increase [PgUp] or Decrease [PgDn] deactivates auto-scaling and increases or decreases the graph scale.
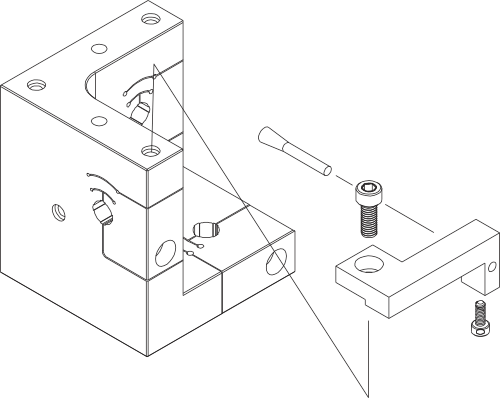
Appendix B: Grounding Brush Installation
An optional carbon fiber grounding brush kit (P017-6152) is available for installation on the probe nest. The brush assures a well grounded precision target pin when rotating. This is generally not necessary, but may be used if there are unusual levels of electrical noise, or if a precise measurement is being made of a high-performance spindle.
Mount the bracket to the probe nest using the socket head cap screw as shown in the image below.
Insert the grounding brush as shown and secure it with the smaller socket head cap screw from beneath.
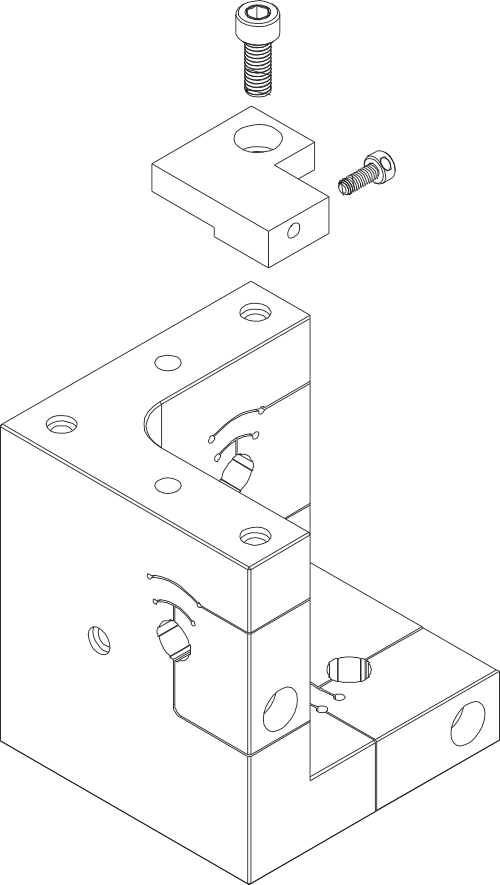
Appendix C: Index Sensor Bracket Assembly
If using an existing probe nest without an Index Sensor bracket, the bracket will have to be installed on the probe nest.
Install the Index Sensor Bracket (P017-6157) with one socket head cap screw as shown below. The smaller screw is inserted in the side of the bracket to secure the index probe in place.
The index probe is fragile, do not over tighten the securing screw.
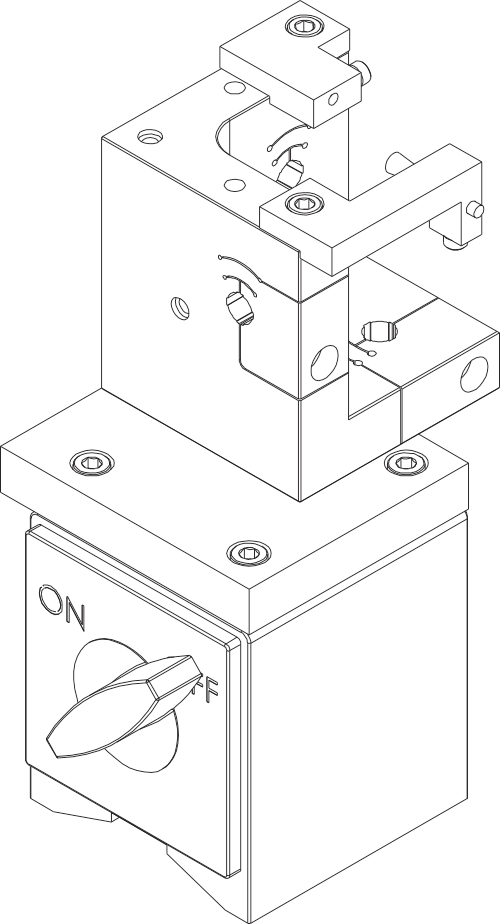
Appendix D: Magnetic Base Installation
A magnetic base kit is available for existing probe nests (P017-6117). Install as follows:
Remove the three socket head cap screws that secure the existing base to the probe nest and remove the base.
Use the three shorter socket head cap screws supplied with the kit to install the magnetic base adapter bracket to the probe nest in place of existing base.
Use the three socket head cap screws to secure the probe nest/adapter plate assembly to the magnetic base.

Appendix E: Complete Magnetic Base Probe Nest Assembly (with Grounding Brush)
Appendix F: Replacement Parts

GLOSSARY
Many of the definitions here are taken from ASME B89.3.4-2010: Axes of Rotation: Methods for Specifying and Testing.
Asynchronous error motion – the portion of the total error motion that occurs at frequencies other than integer multiples of the rotation frequency. Asynchronous error motion comprises those components of error motion that are: (a) not periodic (b)periodic but occur at frequencies other than the spindle rotational frequency and its integer multiples, (c) periodic at frequencies that are subharmonics of the spindle rotational frequency.
Asynchronous error motion value – the maximum scaled width of the asynchronous error motion polar plot, measured along a radial line through polar chart center.
Axial error motion – error motion coaxial with the Z reference axis. Axial slip, end- camming, pistoning and drunkenness are common but inexact terms for axial error motion.
Axial thermal drift – applicable when the displacement is collinear with the Z reference axis.
Axis average line – a line segment passing through two axially separated radial motion polar profile centers. The axis average line is used to describe the unambiguous location of an axis of rotation with respect to the reference coordinate axes, or changes in the location, for example, in response to changes in load, temperature or speed.
Axis of rotation – a line segment about which rotation occurs
Axis shift – a change in position of the axis of rotation caused by a change in operating
conditions.
Bearing – an element of a spindle that supports the rotor and allows rotation between the rotor and the stator.
Displacement indicator – a device that measures displacement between two specified objects.
Error motion – changes in position, relative to the reference coordinate axes, of the surface of a perfect workpiece, as a function of rotation angle, with the workpiece centerline coincident with the axis of rotation.
Face error motion – the sum of the axial error motion and the axial component of tilt motion at the specified radius. Face error motion is parallel to the Z reference axis at a specified radial location. The term “face runout” has an accepted meaning analogous to radial runout and hence is not equivalent to face error motion.
Face thermal drift – applicable to a combination of axial and tilt displacement measured at a specified radial location.
Fixed sensitive direction – the sensitive direction is fixed when the workpiece is rotated by the spindle and the point of machining or measurement is not rotating.
Fundamental error motion – that portion of the total error motion that occurs at the rotational frequency of the spindle. Fundamental axial and fundamental face motions are error motions and cause flatness errors on parts. However, fundamental error motion will create a part with the property of circular flatness: The surface is flat and will provide a “sealing surface” at any given radius. This unique property is important to the hydraulic industry. Fundamental radial and fundamental tilt displacements are not error motions because they represent misalignment of the artifact, not a property of the axis of rotation. Fundamental axial and fundamental face motions are error motions and have important engineering consequences.
Fundamental error motion value – twice the scaled distance between the PC center and a specified polar profile center of the synchronous error motion polar plot. Alternatively defined as the amplitude of the rotational frequency component. The value is twice the amplitude because, in this case, amplitude represents the average-to-peak value rather than the peak-to-peak value. Fundamental axial value and fundamental face value are the same value. There is no fundamental radial error motion value – in the radial direction, motion that occurs at the rotational frequency is caused by an off-center reference target and is not a property of the axis of rotation.
Least squares circle (LSC) center – the center of a circle which minimizes the sum of the squares of a sufficient number of equally spaced radial deviations measured from it to the error motion polar plot.
Nonsensitive direction – is any direction perpendicular to the sensitive direction. Perfect spindle – a spindle having no motion of its axis of rotation relative to the
reference coordinate axes.
Perfect workpiece – a rigid body having a perfect surface of revolution about a center line
Radial error motion – error motion in a direction perpendicular to the Z reference axis and at a specified axial location.
The term “radial runout” has an accepted meaning which includes errors due to centering and workpiece out-of-roundness and hence is not equivalent to radial error motion.
Radial thermal drift – applicable when the displacement is perpendicular to the Z reference axis.
Residual synchronous error motion – the portion of the axial and face synchronous error motion that occurs at integer multiples of the rotation frequency other than the fundamental. Residual synchronous and synchronous error motions are mathematically identical. These type of errors cause flatness errors on the face of turned parts.
Residual synchronous error motion value-the scaled difference In radii of two concentric circles from a specified error motion center just sufficient to contain the residual synchronous error motion polar plot.
Rotating sensitive direction – the sensitive direction is rotating when the workpiece is fixed and the point of machining or measurement rotates.
Rotor – the rotating element of a spindle.
Runout – the total displacement measured by a displacement indicator sensing against a moving surface or moved with respect to a fixed surface. The terms “T.I.R.” (total indicator reading) and “F.I.M.” (full indicator movement) are equivalent to runout. Surfaces have runout; axes of rotation have error motion. Runout includes errors due to centering and workpiece form errors and hence is not equivalent to error motion.
Sensitive direction – the sensitive direction is perpendicular to the perfect workpiece surface through the instantaneous point of machining or measurement
Spindle – a device which provides an axis of rotation. Stator – the stationary element of a spindle.
Stator-to-rotor error motion – generic term for any error motion associated with a spindle measured between the ends of a minimal structural loop.
Structural error motion – error motion due to internal or external excitation and affected by elasticity, mass, and damping of the structural loop.
Structural loop – the assembly of components which maintain the relative position between two specified objects.
Synchronous error motion – the components of total error motion that occur at integer multiples of the rotation frequency. The term average error motion is equivalent but no longer preferred. The method of averaging described in B89.3.4 Fig A11 remains acceptable for the determination of synchronous error motion.
Synchronous error motion value – the scaled difference in radii of two concentric circles from a specified error motion center just sufficient to contain the synchronous error motion polar plot.
Thermal drift – a changing distance or angle between two objects associated with a changing temperature distribution within the structural loop.
Thermal drift plot – a time-based record of thermal drift.
Thermal drift value – the difference between the maximum and minimum values over a
specified period of time and under specified conditions.
Tilt error motion – error motion in an angular direction relative to the Z reference axis. Coning, wobble, swash, tumbling and towering errors are common but inexact terms for tilt error motion.
Tilt thermal drift – applicable to a tilt displacement relative to the Z reference axis. Total error motion – the complete error motion as recorded.
Total error motion value – the scaled difference in radii of two concentric circles from a specified error motion center just sufficient to contain the total error motion polar plot.
SOFTWARE LICENSE AGREEMENT
By receipt and use of this LION PRECISION product you, the end user, and LION PRECISION agree to and are bound by the terms of this license agreement. If the terms of the agreement are not acceptable to you, return the product to LION PRECISION for full credit. The terms of the agreement are as follows:
1. GRANT OF LICENSE. In consideration of payment of license fee, which is a part of the purchase price of this product Lion Precision grants you, the LICENSEE, nonexclusive rights to use the included Lion Precision software on a single computer at any one moment in time.
2. OWNERSHIP OF SOFTWARE. As the LICENSEE, you own the media upon which any Lion Precision software is stored but Lion Precision retains title and ownership of the software recorded on the original media as well as all subsequent copies of the software. This license IS NOT a sale of the original software. Only the right to use it.
3. COPY RESTRICTIONS. This software and the accompanying written materials are copyrighted. Unauthorized copying or modifying of this software is strictly forbidden. You may be held legally responsible for any copyright infringement or encouraged by your failure to abide by this agreement. Subject to these restrictions, the LICENSEE may make two (2) copies for backup purposes only. LICENSEE takes full responsibility for the use, and or any distribution of, any copied software according to this license agreement.
4. USE RESTRICTION. As the LICENSEE you may transfer the software from one computer to another, provided the software is used on only one computer at any one time. You may not electronically transfer the software over any network or bulletin board service. You may not distribute this software or accompanying written materials to others. You may not modify, translate, reverse engineer, decompile, or disassemble the software.
5. UPDATE POLICY. Lion Precision may create, from time to time, updated versions of the software. At its option, Lion Precision will make such updates available to the LICENSEE.