
SPINDLE ERROR ANALYZER 9.0 – Machine Tool Inspection
USER’S GUIDE
TABLE OF CONTENTS
- INTRODUCTION
- INSTALLATION
- USING THE SEA 9.0 SOFTWARE
- SEA SETTINGS
- MAKING MEASUREMENTS AND READING PLOTS
- APPENDICES
- GLOSSARY
- SOFTWARE LICENSE AGREEMENT
INTRODUCTION
The Spindle Error Analyzer System is a hardware and software package for measuring and analyzing the accuracy of spindle rotation on machine tools, hard-disk drives etc. It also measures changes in position of the machining point due to thermal effects.
Fundamental Concepts
SEA uses noncontact, capacitive sensing to measure error motions of the axis of rotation as changes in position of precision master targets installed and rotating in the machine spindle. The sensors have a typical range of 250 µm with a resolution of 15 nm RMS. Actual values may vary depending on the specifics of the system ordered.
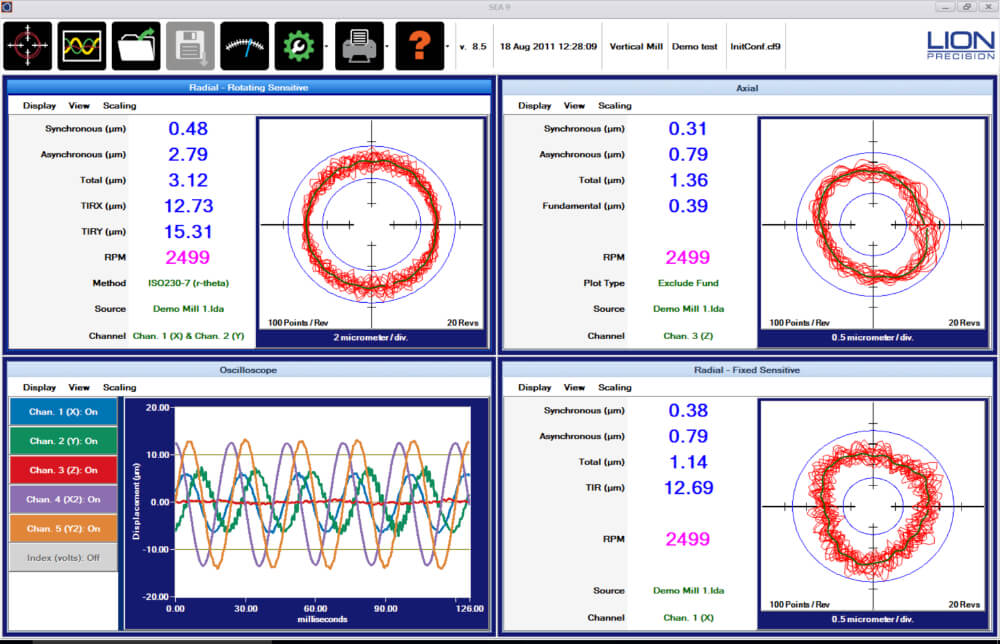
The measurements are collected and analyzed by the SEA software. The results of the active measurement or archived measurement file are presented on polar or linear plots with calculated values of error motion measurements.
- SEA performs the following tests as described in ISO and ANSI/ASME standards:
- Radial rotating sensitive direction
- Radial fixed sensitive direction
- Tilt fixed sensitive direction
- Axial error motion
- Thermal stability
- Temperature variation error
- Shift vs. RPM
Additional Capabilities of SEA
- FFT Analysis
- Oscilloscope display
- Analog meter display
- Donaldson reversal test
- Automated Test Sequencing
Standards and References
- ANSI/ASME Standard B5.54-2005, Methods for Performance Evaluation of CNC Machining Centers
- ISO230 Part 3 (2001), Test Conditions for Metal Cutting Machine Tools, Evaluation of Thermal Effects
- ISO230 Part 7 (2005), Geometric Accuracy of Axes of Rotation
- ANSI/ASME B5.57-2012, Methods for Performance Evaluation of CNC Turning Centers
- ANSI/ASME B89.3.4-2010, Axes of Rotation, Methods for specifying and testing
Assistance
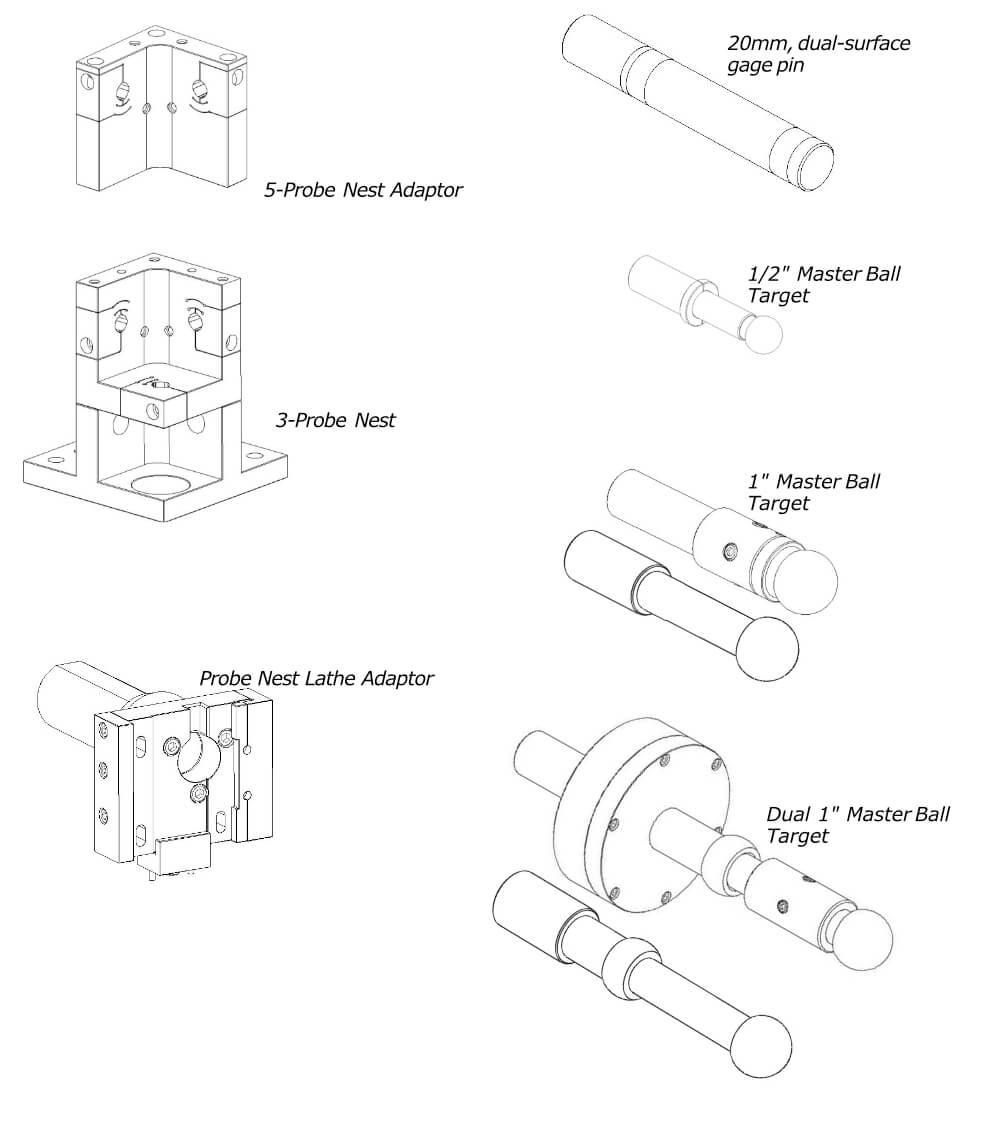
Drawings below identify some of the mechanical components included in the SEA system.
 |
INSTALLATION
Install all software before installing the data acquisition device.
- NOTE
- The SEA software installation includes installation of all required National Instruments driver software.
- Do not install any software from National Instruments disks included with the National Instruments data acquisition hardware.
Minimum Requirements
- Windows 7 or higher, 64 bit
- 1 GB Ram; 1 GB Free Disk Space (minimum)
- 1 GHz Processor
- 1 Available USB port; 1024 x 768 Minimum Screen Resolution
Procedure
- NOTE
- The SEA installation program installs all necessary hardware drivers. Do not install National Instruments software separately.
The SEA program is installed in the C:\Program Files (x86)\Lion Precision\ SEA9 directory. If you install the SEA software a second time using the same subdirectory, you will be prompted to confirm the overwrite of the previous installation.
To use the SEA 9 flash drive:
- Insert the Lion Precision SEA 9 flash drive in an available USB port.
- View the contents of the flash drive.
- Run SEA 9 Install.exe
- Follow the directions of the installation programs.
- Once the installation has copied all files, restart the computer.
- After restarting, run the program by selecting the icon on the desktop, or by selecting Start > All Programs > SEA 9.exe.
Demo data files and other valuable documents related to spindle measurement and improving machined part quality are included in the installation. These files are found in these directories:
- Documents: C:\Users\<user>\Documents\LionPrecision\SpindleErrorAnalysis\Docs
- Demo Data Files: C:\Users\<user>\Documents\LionPrecision\SpindleErrorAnalysis\Data
SEA requires a National Instruments USB-6251, USB-6281, or USB-6366 Data Acquisition System.
- NOTE
- These are the only DAQ devices supported. Use of any other DAQ Device will produce unpredictable results.
All National Instruments software was installed with the SEA 9 installation. Do not install any National Instruments software from National Instruments CD/DVDs.
If your Elite Series sensor system is marked on the rear panel as “SEA Software Enabled” you will not require a security key. If you are using an older Elite Series system without that marking, the security key must be attached to a USB port on the computer to perform measurements and collect data. The security key is not required to view or print saved data files.
See Mounting Probes and Targets section (page 18).
USING THE SEA SOFTWARE
When the program is launched (Start > SEA 9), a splash screen will display during initialization. After initialization, the Main Program Screen will display with four test/data quadrants. No data is displayed as the system is in “Idle” mode awaiting the operator’s selection to Open Data File or view Live Data.
 |
SEA 9 has five operating modes. Current mode is indicated by the color of the Top Menu bar:
Idle: After launch, program in Idle mode awaiting operator input. Top Menu color: White
File View: The program is displaying data from a loaded data file. Top Menu color: White
Live Data: The program is receiving and displaying data from the DAQ system. If the spindle is not turning, no data will be displayed in the rotating test quadrants, but data will display in the oscilloscope and thermal quadrants. Top Menu color: Green
Paused: The program is receiving and displaying data from the DAQ system but only the data at the time the system was paused is displayed. Top Menu color: Yellow
Error: There is a program error or connection to the electronics has been lost. No data is being collected or displayed. Check the electronics connection or restart the program. Top Menu color: Red
The SEA software uses several simple conventions that make the software easy to use.
- • Menus display lists of selectable options.
- • Buttons execute or gain access to features.
- • Panels display fields of information.
Top Menu
 |
Plots: Displays the last four selected test quadrants. (This selection will always display test panels in all four quadrants, even if a Settings panel had been previously displayed in one of the quadrants.)
Live Data: Select this icon only if SEA electronics (DAQ Module and Elite Chassis) are connected to the computer. The program will detect the DAQ device on the USB port. If there is more the one DAQ device detected, then the Select DAQ Device Dialog will be displayed.
Run/Pause Data: This button is only visible when the electronics are connected and SEA 9 is receiving Live Data from a rotating spindle. When rotation is first detected, SEA 9 will enter Run mode and the button will display Pause Data.
Clicking Pause will immediately freeze the screen with the last revolutions of data and change the Status Bar color to yellow. This mode can be used for closer examination of the data, for saving a data file, and for capturing a screen print. When Paused, the button will change to Run. Clicking Run resumes the process of collecting measurement data from the device and displaying it.
Open Data File: Opens a *.lda rotational data file select dialog box. The selected file data is displayed in the test panels and the settings panels display the settings in use when the data was selected. (Thermal test files are loaded separately in the Thermal panel.) No electronics need to be connected to view files. SEA 9 can view files created with SEA 8, but cannot display files created by SpindleCheck.
Save Data File: Saves the current rotational test data to a file. SEA 9 will immediately freeze the screen with the last revolutions of data and change the Status Bar color to yellow during the save process. After the data is saved, SEA 9 will return to ‘Live’ state (Menu Bar color to green). Unavailable in File View or Idle mode.
Probe Meter: When connected to the electronics, the Probe Meter is displayed. This is useful for probe placement during setup and for seeing low frequency machine structural movements when the spindle is not rotating.
Settings:
- Show Settings: Displays Settings panels in all four quadrants. (This will always display Settings panels in all four quadrants, even if a test panel was previously selected for one of the quadrants.)
- Load Settings: Loads an existing Settings file (*.cf9) and changes to Settings view.
- Save Settings: Saves the current Settings to the current file name. (Disabled during File View mode)
- Save Settings As: Saves the current Settings to a new file name.
Print Screen: Prints the current screen to a printer, PDF, or print preview. When printing, panel backgrounds are changed to light gray for better printing results.
Status Bar
 |
The Status Bar is to the right of the Top Menu. It contains information about the data currently being viewed. That data will differ in File View and Live Data modes.
Version (v.):
- Live Data Mode: Current version of the SEA 9 software
- File View Mode: Version of software in use when the data was collected
Date/Time:
- Live Data Mode: Current date and time
- File View Mode: Date and time the data was collected
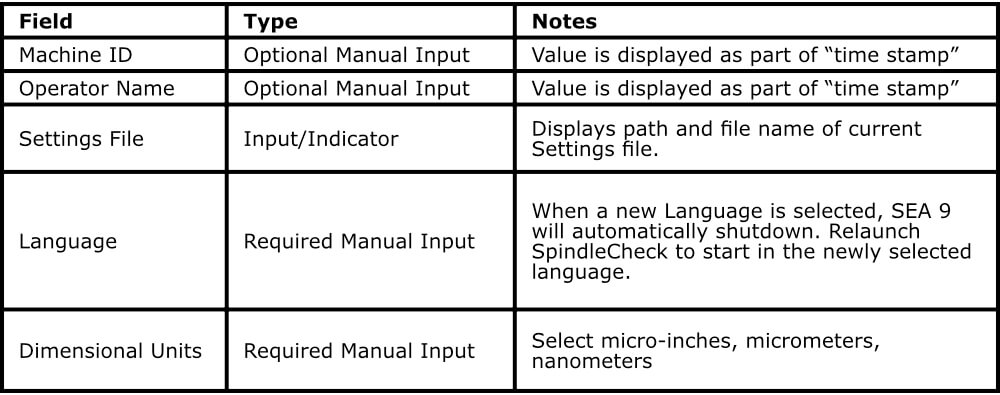
Machine ID: Displays the current text in the Machine ID field of the General settings panel.
- Live Data Mode: Current machine ID in General Settings panel
- File View Mode: Machine ID in file being viewed
Operator Name:
- Live Data Mode: Current operator name in General Settings panel
- File View Mode: Operator name in file being viewed
Settings File Name: Displays current Settings file name for Live Mode operation
SEA 9 displays four quadrants on your screen. Quadrants can display two basic types of panels:
Test/Data/Measurement panels (blue background) and Settings panels (yellow background).
Each quadrant has its own menu bar. Each begins with Display. The Display menu offers a dropdown list of panels which can be selected for that quadrant.
If a selected panel is already being displayed in a different quadrant these two panels will switch positions on the screen.
Keyboard shortcuts execute in the “Active Quadrant” which is indicated by a darker blue title bar across the top. A quadrant is made active by clicking anywhere in the quadrant.
Quadrant menu contents are dependent on the panel being displayed. Details of the menu options available are listed in Appendix A, Menu Item Descriptions p. 33.
Notes panel
Screen prints are often used to document spindle tests. It is helpful to have test information displayed on the screen when the screen is printed.
To display the Notes panel, select Display > Notes in a quadrant.
Click in the text box to enter text. To change the displayed image (Spindle Error Analyzer logo is default), select View > Select Graphic from the Notes panel’s tool bar.
Maximizing Displays to Full Screen
Initially, each panel appears in a quadrant. Select View > Maximum Size to fill the entire screen, or double click the right mouse button on the panel to be maximized.
Minimizing Displays to a Quadrant
Select View > Normal Size to return a maximized panel to its quadrant, or double click the right mouse button on the panel.
To select a language other than English:
In the Main Menu Bar, select Settings > Show Settings
On the General Settings panel select the desired language from the Language drop down menu.
When the new Language is selected, SEA 9 will automatically shutdown. Relaunch to start in the newly selected language.
SEA SETTINGS
SEA software must be properly configured for proper operation. Most of the required settings are correct when SEA is installed. One possible exception is the Target Settings. The default values are for the dual 1 inch master ball. If you are using a different target, you will need to select the correct target in the Target Settings panel. Also, the target’s serial number and roundness error must be added to the Target Settings if those numbers are to be tracked in the data files.
There are different types of Settings fields:
- Indicators: These read-only fields display information acquired from the system or calculated from other fields. They have a lightly shaded background.
- Inputs: These may be required or optional input settings that must be manually entered by the user. Inputs have a white background.
Settings can be saved with Settings > Save Settings in the main menu bar.
Access the Settings panels through Main Menu > Settings > Show Settings
All quadrants will load with settings panels. In Live Mode, these panels display the current measurement Settings. When viewing a file, these panels display the Settings information contained in the file being viewed.
Four Settings Panels
The four panels are detailed below. They include:
General Settings: Basic system wide information.
Analysis settings: Settings related to the speed and nature of the acquisition of measurements from the sensors and how the measurements are displayed.
Diagnostics: Real time measurements from each sensor channel, encoders and temperature sensors. Useful in troubleshooting.
Target Settings: Identifies the target type and shape and the multipliers required for measurements with maximum accuracy.
The General Settings panel contains Tab Pages for General, Calibration Properties, Backplane and DAQ Information.
General Tab
 |
Calibration Properties Tab
During live measurements, the Calibration Properties panel displays calibration details of the Elite Series device currently connected. When viewing a file, it displays the calibration details of the system used when the file was created.
Calibration information is acquired through TEDS (Transducer Electronic Data Sheet) technology in the Elite Series electronics. This is automated and these values cannot be changed.
The Low/High Sensitivity switch is used to remotely change a sensing channel’s sensitivity (CPL290 product only). The Sensitivity switches on the driver front panel are disabled when the sensing system is connected to the SEA data acquisition system.
Backplane and DAQ Module Properties
This panel displays the properties and parameters of the Elite Series electronics and the DAQ Module attached to the USB Port. This information is primarily for troubleshooting purposes and is rarely referenced in general operation.
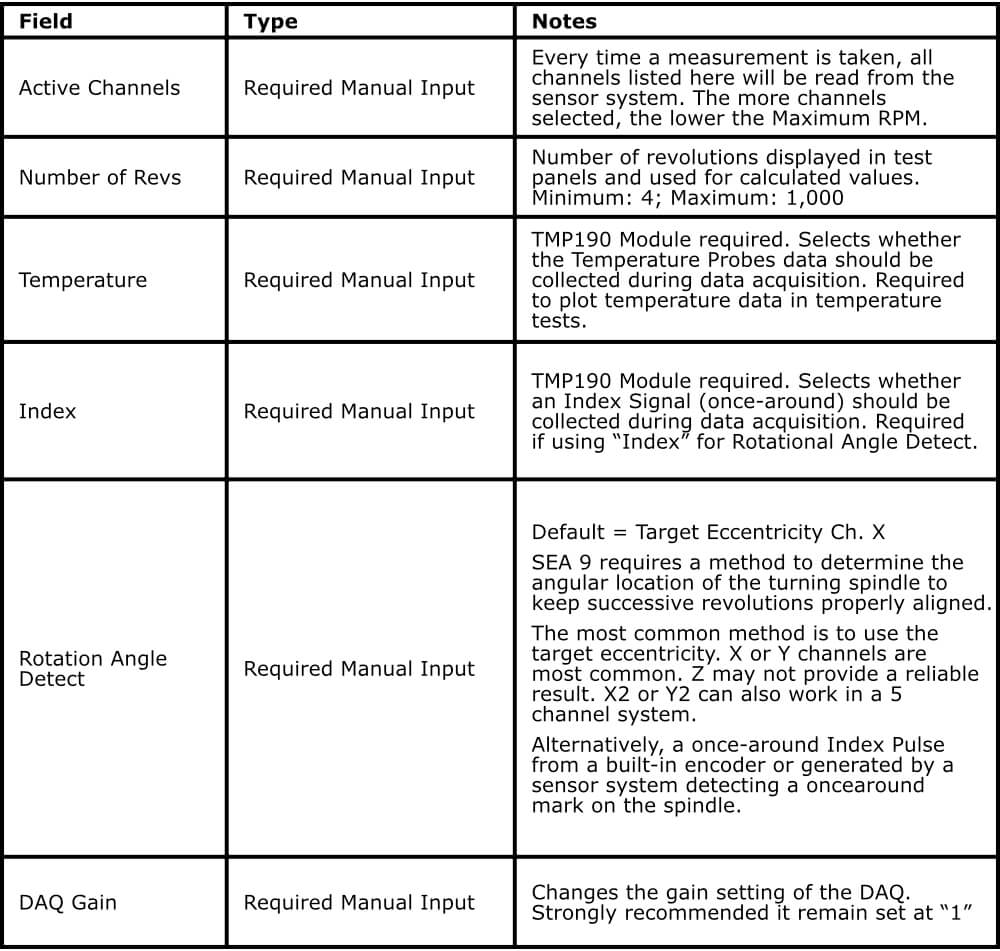
Analysis Settings
Sampling frequency limitations of the DAQ device and software memory allocation limitations determine the maximum settings for some entries in the Analysis Settings.
Maximum RPM will decrease when either of these are increased:
• Active Channels (including Temperature and Index inputs)
• Points per Rev(Revolution)
(Number of Revs) X (Point per Rev) must be less than 64,000.
- NOTE
- Changes to these settings are not applied until Apply Settings is clicked. Previous settings are stored and can be restored by clicking the Revert button.
General Analysis Settings
 |
Analysis Modes
Three analysis modes are available:
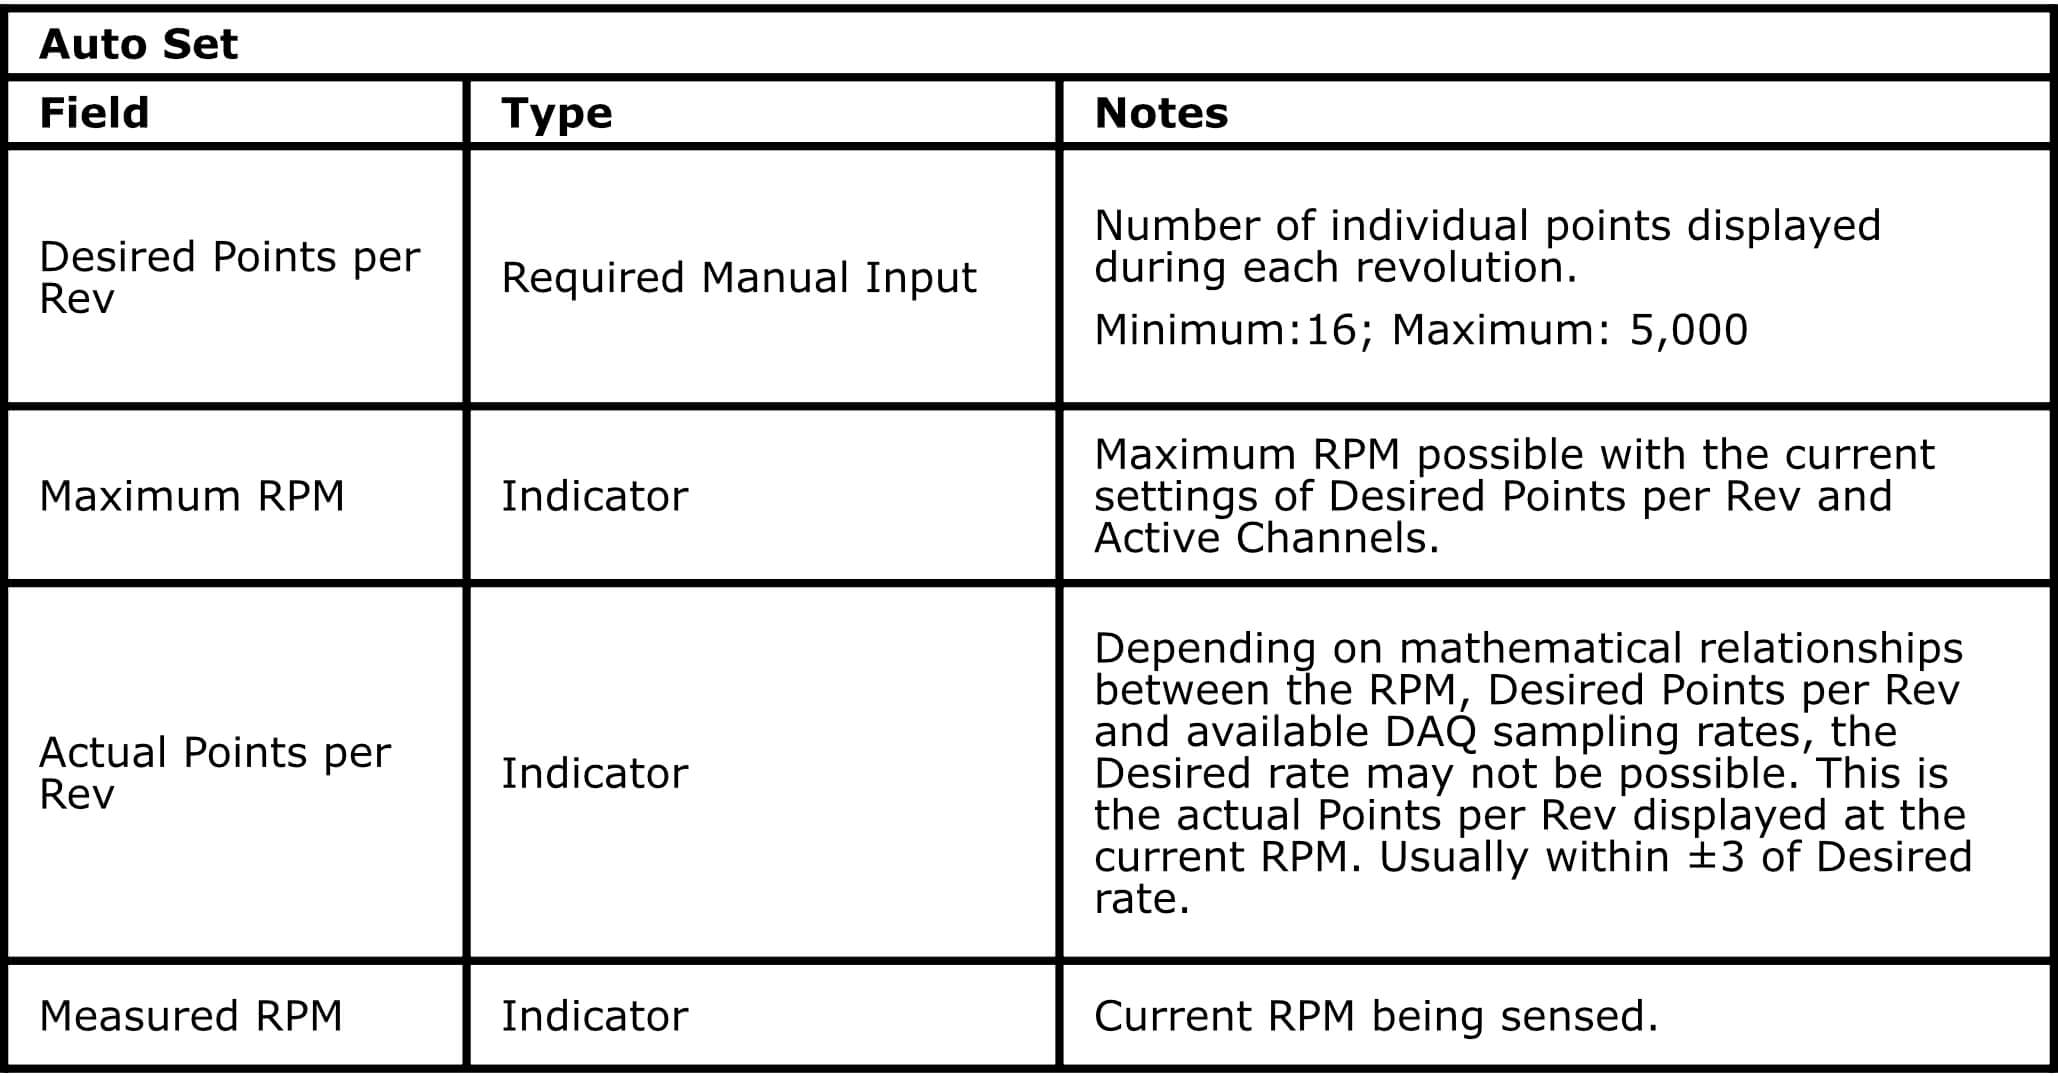
Auto Set (Strongly recommended): The user only needs to indicate the desired points per revolution. Indicators inform of the maximum RPM with current general analysis settings: Reliable, error-proof measurement.
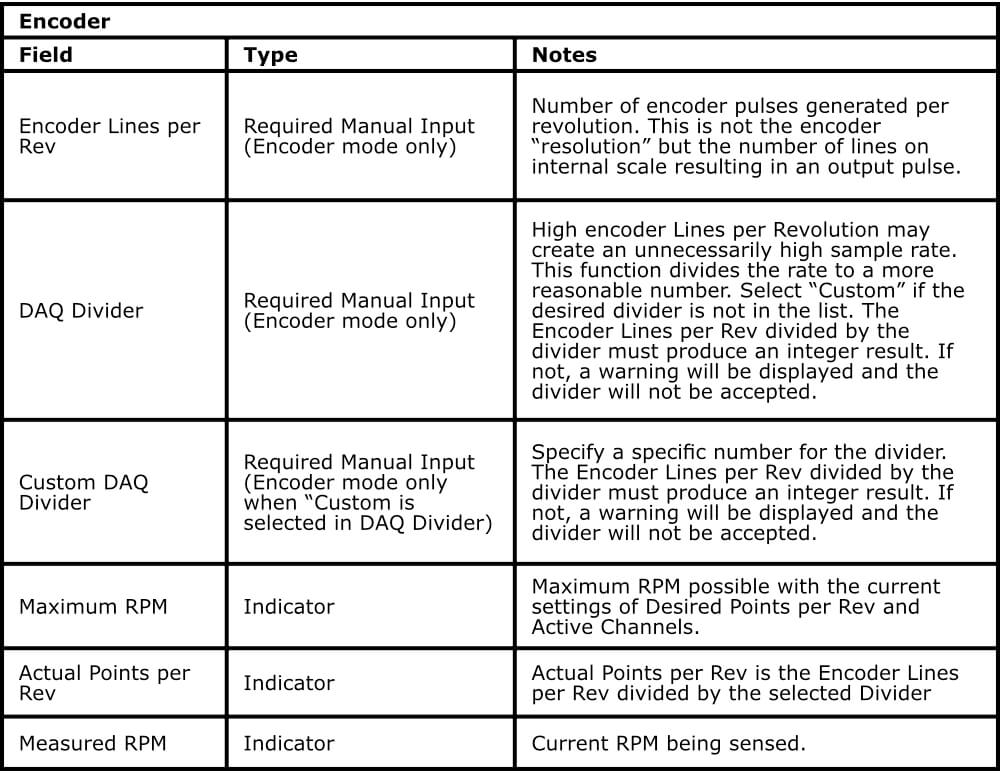
Encoder: An encoder connected to the spindle is used to trigger DAQ samples.
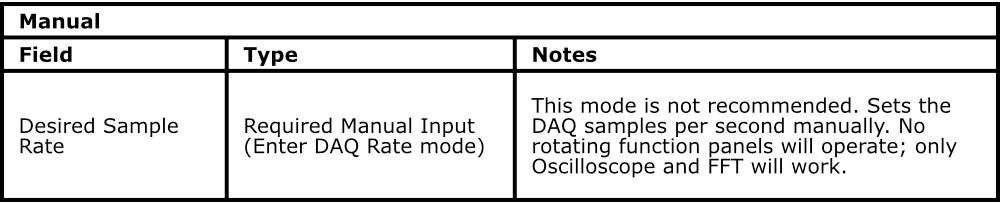
Manual: Directly enter the DAQ sample rate. FFT and Oscilloscope are the only panels enabled in this mode. This mode is intended for those who wish to create a data file at a specific sampling rate for analysis in their own systems.
The currently selected mode is highlighted with a blue title bar; the others are gray. To change mode, click the title bar for the desired mode.
|
|
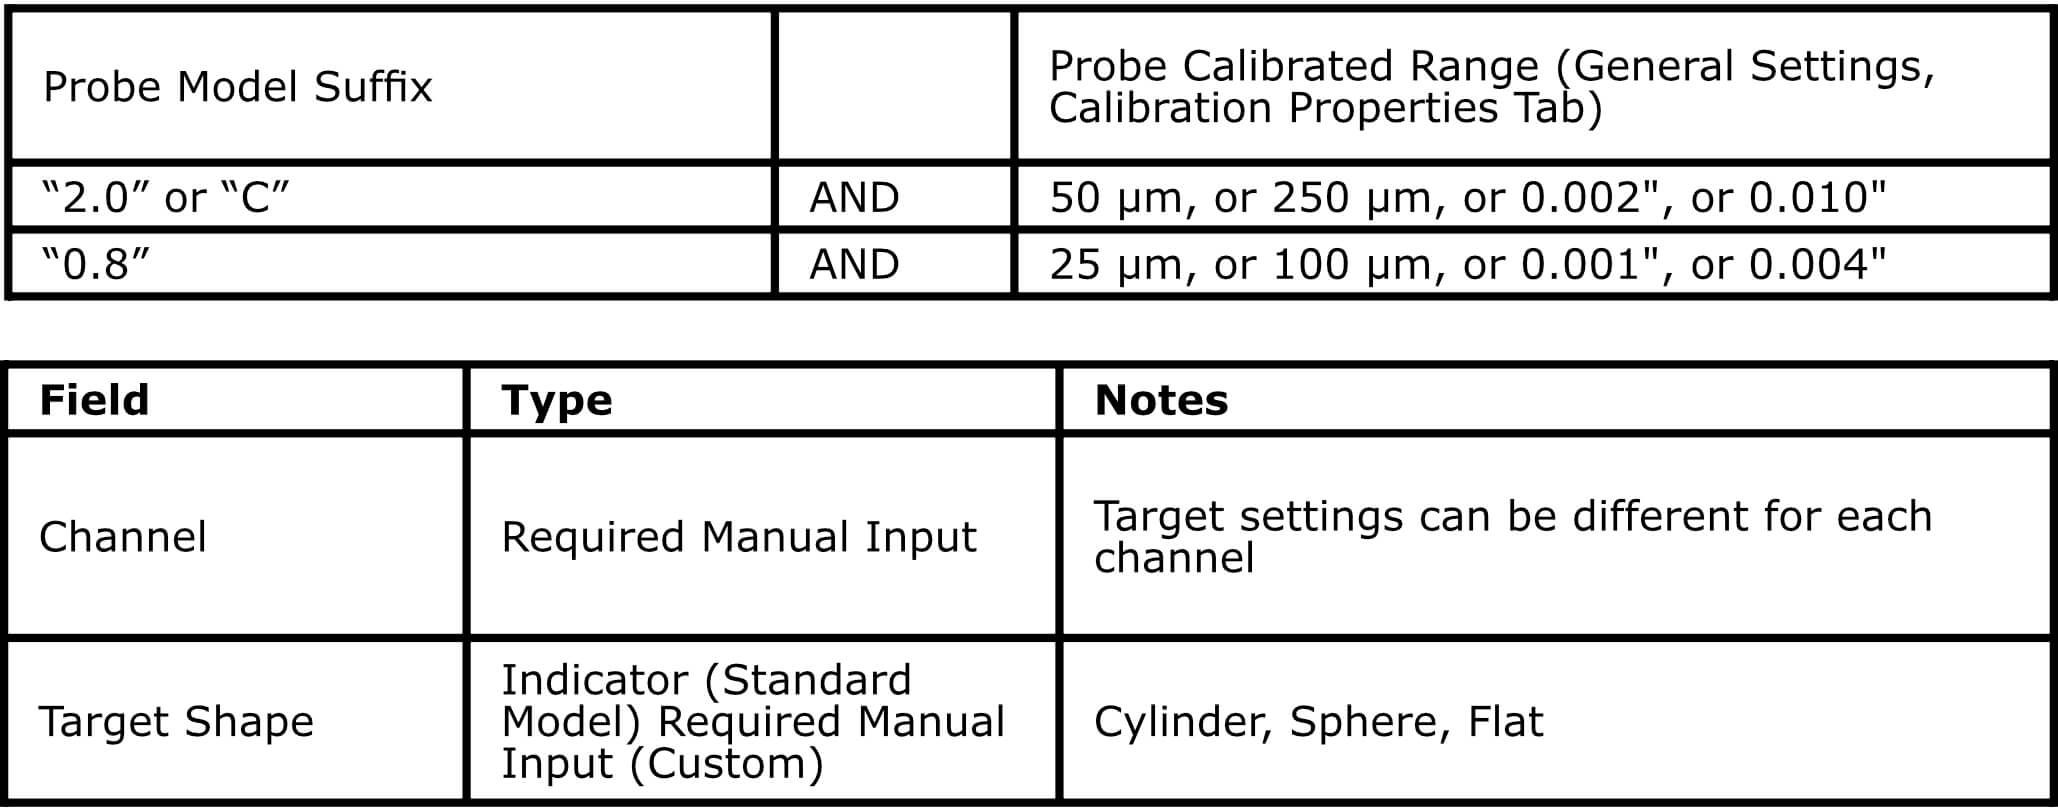
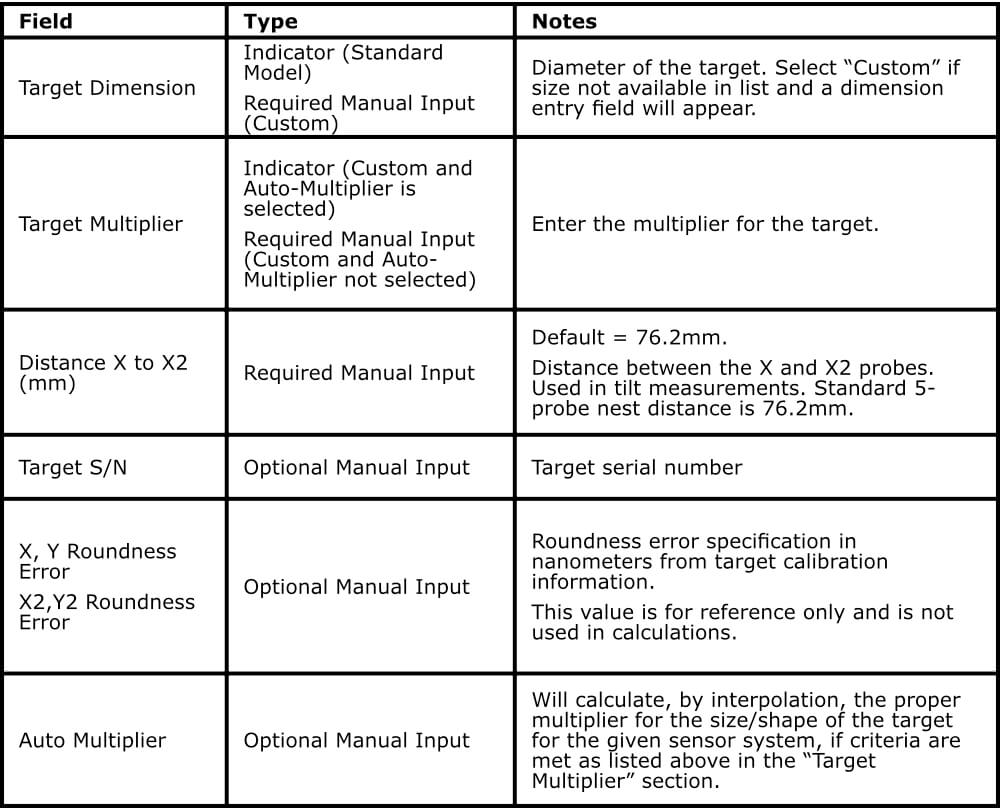
Target size and shape are a critical factor in measurement accuracy. Sensors are calibrated for flat targets; round targets require a correction factor (multiplier) which is different for each size and shape combination. Each channel of measurement can have separate target specifications.
Select Target Size/Shape
Select your target model by clicking its image at the top of the panel. The currently selected model is highlighted with a green background. All values on the panel (except Serial Number and Roundness Error) will automatically populate with the correct settings for the selected target.
Custom Target Settings
If not using one of the standard targets shown, select Custom; in this case, the shape and dimension must be manually entered for each axis.
Auto-Multiplier
When selected, the Auto-Multiplier function will calculate the appropriate multiplier if the target is a cylinder with diameter between 3 mm (0.12″) and 25.4 mm (1″) or a sphere with diameter between 12.7 mm (0.5″) and 25.4 mm (1″) and when one of the following conditions exist:
|
|
The Diagnostics panel shows real time measurements from the probes and other variables used in measurement calculations. This panel is a troubleshooting aid and is not required during normal operation.
MAKING MEASUREMENTS AND READING PLOTS
Understanding and Interacting with Plots
Adjusting Plot Displays
Scaling
Use the Scaling menu to select Auto or Manual scaling. Auto scaling adjusts to provide the best view of the existing data. Select Scaling > Manual > Increase or Decrease, or use Page Up and Page Down keys to adjust scaling manually. Axis scales of linear plots can also be set manually by clicking on the axis of interest. A popup dialog sets the range of the selected axis, or hit “End” on the keyboard to Auto Scale the plot.
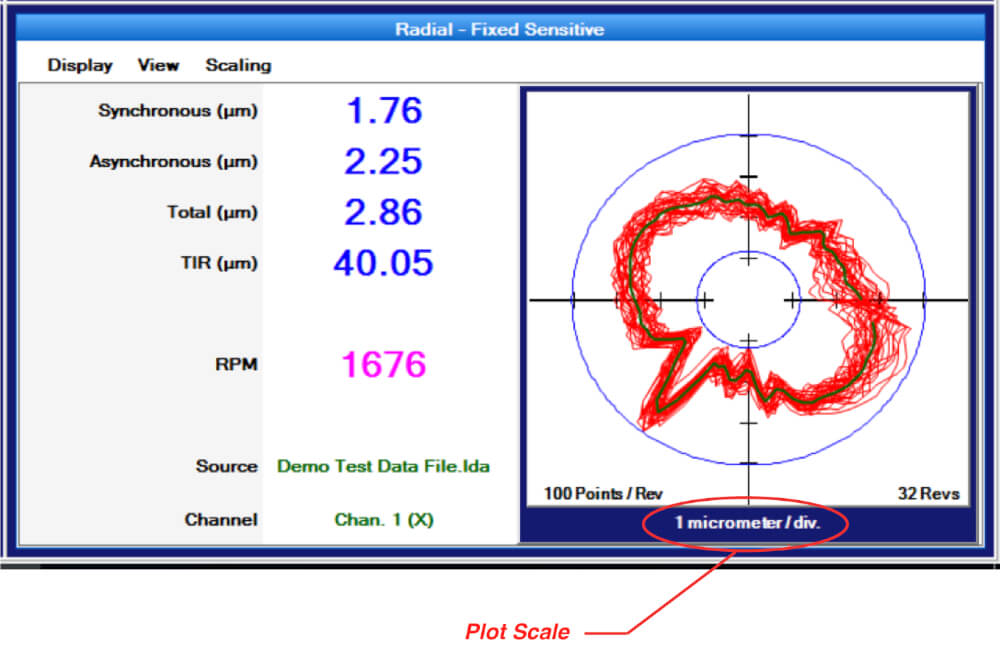 |
Polar plots
Polar plots chart measurements at successive angular locations of the spindle. By default, all acquired rotations are displayed simultaneously. The plot scale is listed at the bottom of the plot. The center of the plot does not represent zero when the axes do not cross (see example at right). This allows sufficient display resolution of small spindle motions, which would be off-screen if the center were zero. Calculated values are to the left of the plot. Definitions of the calculated values are in the glossary in this manual and in Help.
Calculated Circles
Circles can be displayed on the plots to assist in measuring and viewing some important calculated values. To enable circle displays, select View > Circles.
Total – Displays two blue circles. The origin of the circles is at the center of the plot. The inner circle is the largest diameter possible inside of the data points (maximum inscribed circle). The outer circle is the smallest diameter possible outside the data points (minimum circumscribed circle). The distance between the circumferences of these circles is the total error motion.
Average – The average circle is not actually a circle. This green curve is generated by placing a data point at each angular location. The position of the point is equal to the average of the measurements of all the acquired revolutions at that angular location.
M017-8900.002 Spindle Error Analyzer 9.0 Manual 19
To find the center of polar plot data, SEA uses the MLS (Modified Least Squares) method describe in A Few Methods for Fitting Circles to Data by Umback and Jones (IEEE Transactions on Instrumentation and Measurement, V52, I6, December 2003).
Settings
The SEA 9 software must be properly configured in the Settings panels. Much of the required information is accessed directly from the sensing system. Some information must be entered by the user. This information must be properly entered for accurate measurements.
See the Settings section of this manual for details (p. 10).
Connection to PC
For systems that have the DAQ module mounted on top of the Elite Enclosure, simply connect the USB cable between the DAQ module and a USB V2.0 (high speed) port on the PC. The USB v2.0 (high speed) port is necessary due to the high data transfer rates required.
For systems where the DAQ module is NOT mounted on top of the Elite Enclosure, you must also connect a 68 pin cable between the rear panel of the capacitive sensing system and the National Instruments data acquisition system.
|
Mounting Probes and Targets Care and Safety Each target type has a maximum rotational speed. High-speed rotation can create substantial energy, and masterballs adjusted with significant runout will by definition be out of balance. Care must be taken to protect operators when rotating out of balance parts at higher speeds. Guarding is recommended. Positioning the probe nest such that it is between the operator and the spinning target will provide some degree of protection. The masterball targets are high precision components that require special care similar to gauge blocks. For detailed information, please consult TechNote LT03-0013 Probe Mounts and Master Targets: Dimensions, Care, and Adjustment available in the Technical Library at www.lionprecision.com. |
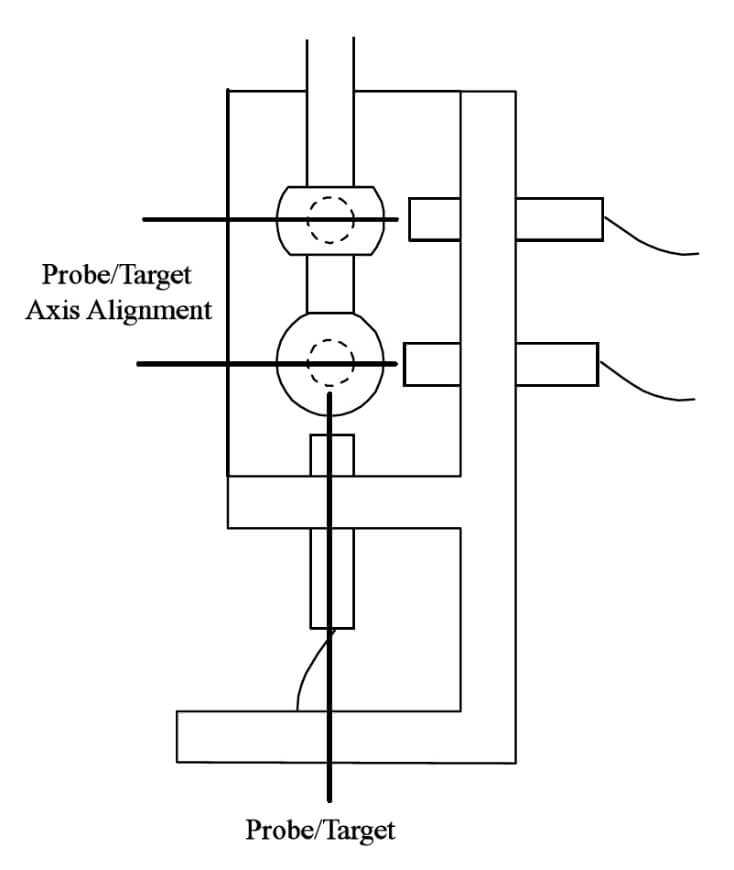 |
Mechanical Setup
There are five goals in the mechanical setup:
- Probes never make contact with target during rotation (incidental contact during setup while the spindle is not rotating is safe).
- Master ball target axes are aligned with probe axes (balls/cylinders are centered on the probes).
- Probes are adjusted to the center of their measurement ranges.
- Target eccentricity is greater than the expected error motions (50 μm typical). Fixed eccentricity targets are preset to 50 μm. Adjustable targets may require adjustment.
- Probes stay in range during the full rotation of the spindle.
Target Installation
Targets are installed in the tool/part holder of the spindle to be tested.
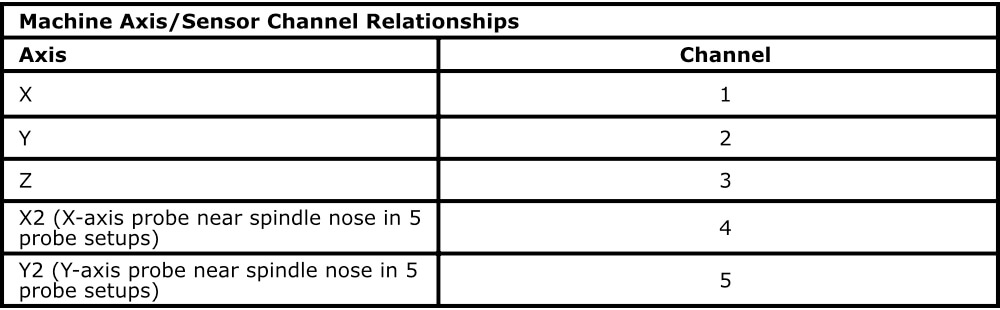
Axis/Sensing Channel Relationships
 |
Probe Nest
Loosen the clamp screws if necessary and install the probes in the nest. Tighten the probe clamps such that the probes are held in place but can still be repositioned by hand.
Mount the probe nest such that the rotating target can be moved into range of the probes in the nest.
- CAUTION
- It is critical to firmly clamp the probe nest to the machine tool table.
Positioning Spindle/Targets and Probes
Each probe must be precisely centered on the spherical or cylindrical surfaces of the targets. Target centers are located and positioned by using the probes and Probe Meter to find the high-spot as the target is repositioned in front of the probe. Center the targets on the probe with a process such as this:
Initial setup
- Ensure the probes are clamped into the nest loosely enough to allow positioning by hand yet tight enough so they do not move unintentionally.
- On the Top Bar Menu, select Probe Meter.
- Move the X-, Y-, and Z-axis probes to a retracted position in the probe nest to prevent collision with the spindle/target when it is moved into approximate position.
- Move the spindle/target in the X- and Y-axes to position it in the probe nest until visually centered on the Z-axis probe.
- Next, move the spindle/target in the Z-axis to approximately center the masterball on the X- and Y-axis probes.
Z-axis centering of masterballs
- Select the Z-axis channel on the Probe Meter
- Adjust the Z-axis probe toward the target until the Near/Far indicator on the driver is in the center position.
- While observing the Probe Meter adjust the machine X-axis position until the high-spot (maximum positive indication to the right) is indicated on the Probe Meter.
- While observing the Probe Meter adjust the machine Y-axis position until the high-spot (maximum positive indication to the right) is indicated on the Probe Meter.
- The target is now centered over the Z-axis probe.
- Move the Z-axis probe away from the spindle so it will not be touched during the following steps.
X/Y-axis centering
- Select the X channel on the Probe Meter
- Adjust the X-axis probe position toward or away from the target until the Near/Far indicator on the respective driver is in the center position.
- Adjust the spindle Z-axis position until the high-spot (maximum indication to the right) is indicated on the Probe Meter.
- Using the Near/Far indicator on each respective channel, adjust the X- and Y-axis probe positions toward or away from the target until they are at the center of range.
Return Z-axis probe to position
- Select the Z channel on the Probe Meter M017-8900.002 Spindle Error Analyzer 9.0 Manual 22
- Move the Z-axis probe toward the target until the Near/Far indicator on the driver is in the center position.
Measuring/Adjusting Target Eccentricity
Target eccentricity provides a once-around signal to the system for determining the spindle’s angular location and aligning consecutive revolution data. Fixed eccentricity targets are preset to 50 μm and have no adjustments. Adjustable eccentricity targets should be adjust to slightly higher than the expected error motion. 50 μm eccentricity is a typical setting. Smaller eccentricity can be used for extremely accurate spindles. Eccentricity is not required when using an index pulse.
Setting/Testing Eccentricity
- Select an X- or Y-axis probe on the Probe Meter. (If using a dual-ball target and five-probe nest, first select a probe for the ball nearest the spindle nose).
- Click Refresh TIR on the Probe Meter.
- Turn the spindle one rotation.
- The distance between the TIR markers (yellow markers) is the eccentricity of the target
- If eccentricity needs adjustment, adjust the target eccentricity according to TechNote LT03-0013 Probe Mounts and Master Targets: Dimensions, Care, and Adjustment included with the system and available in the Technical Library at www.lionprecision.com.
- When the eccentricity is correct, move all probes into center of range as indicated by Near/Far indicators on the drivers.
- Slowly rotate the spindle again and monitor the Near/Far indicators on all sensor channels. If any channel goes out of range (a red light turns on) during the rotation, slightly reposition that channel’s probe and retry until all probes remain in range during the rotation.
- Tighten all probe clamps.
- Rotate spindle again to confirm all probes remain in range.
Temperature Probe
Magnetic Surface Probe. P016-4050
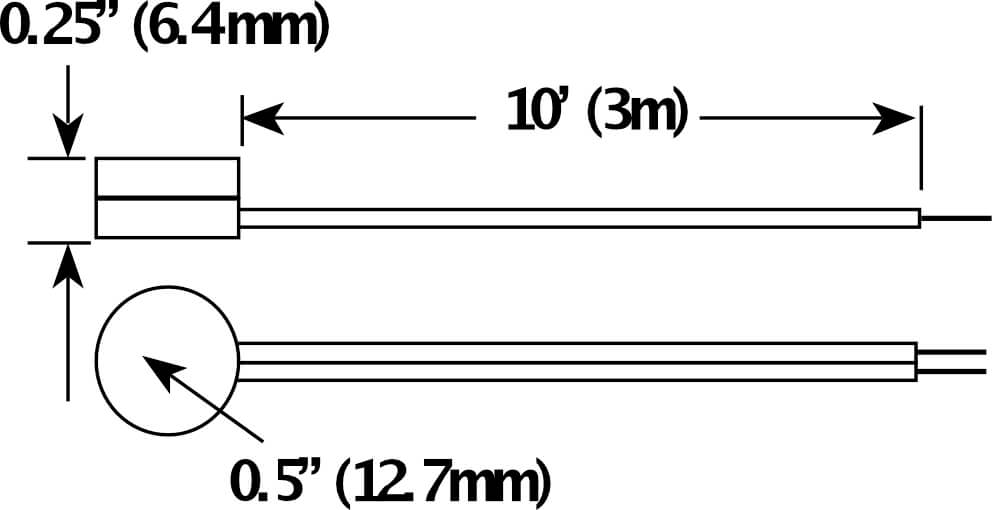
Making Temperature Measurements
Place temperature probes in positions to take desired measurements. The channel indicator (1..7) will be visible when the temperature sensor is positioned properly. When measuring surface temperatures, solid mechanical contact is important.
Block Diagram – Temperature
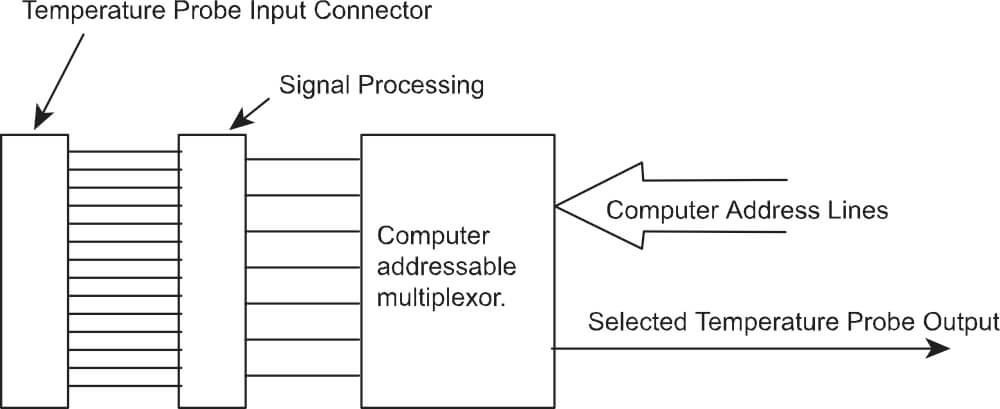 |
Connections to Temperature Probes
The two wires of each temperature probe are connected according to the chart below. The probes are by nature unpolarized so there is no differentiation between the two conductors.
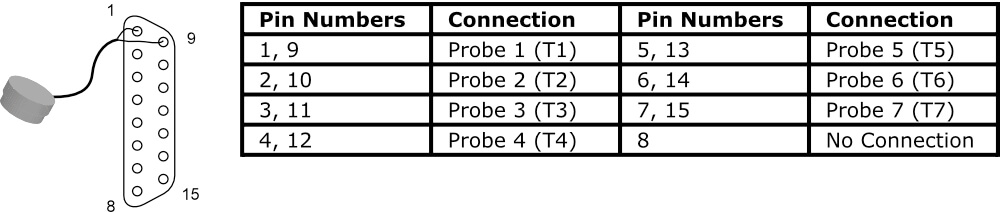 |
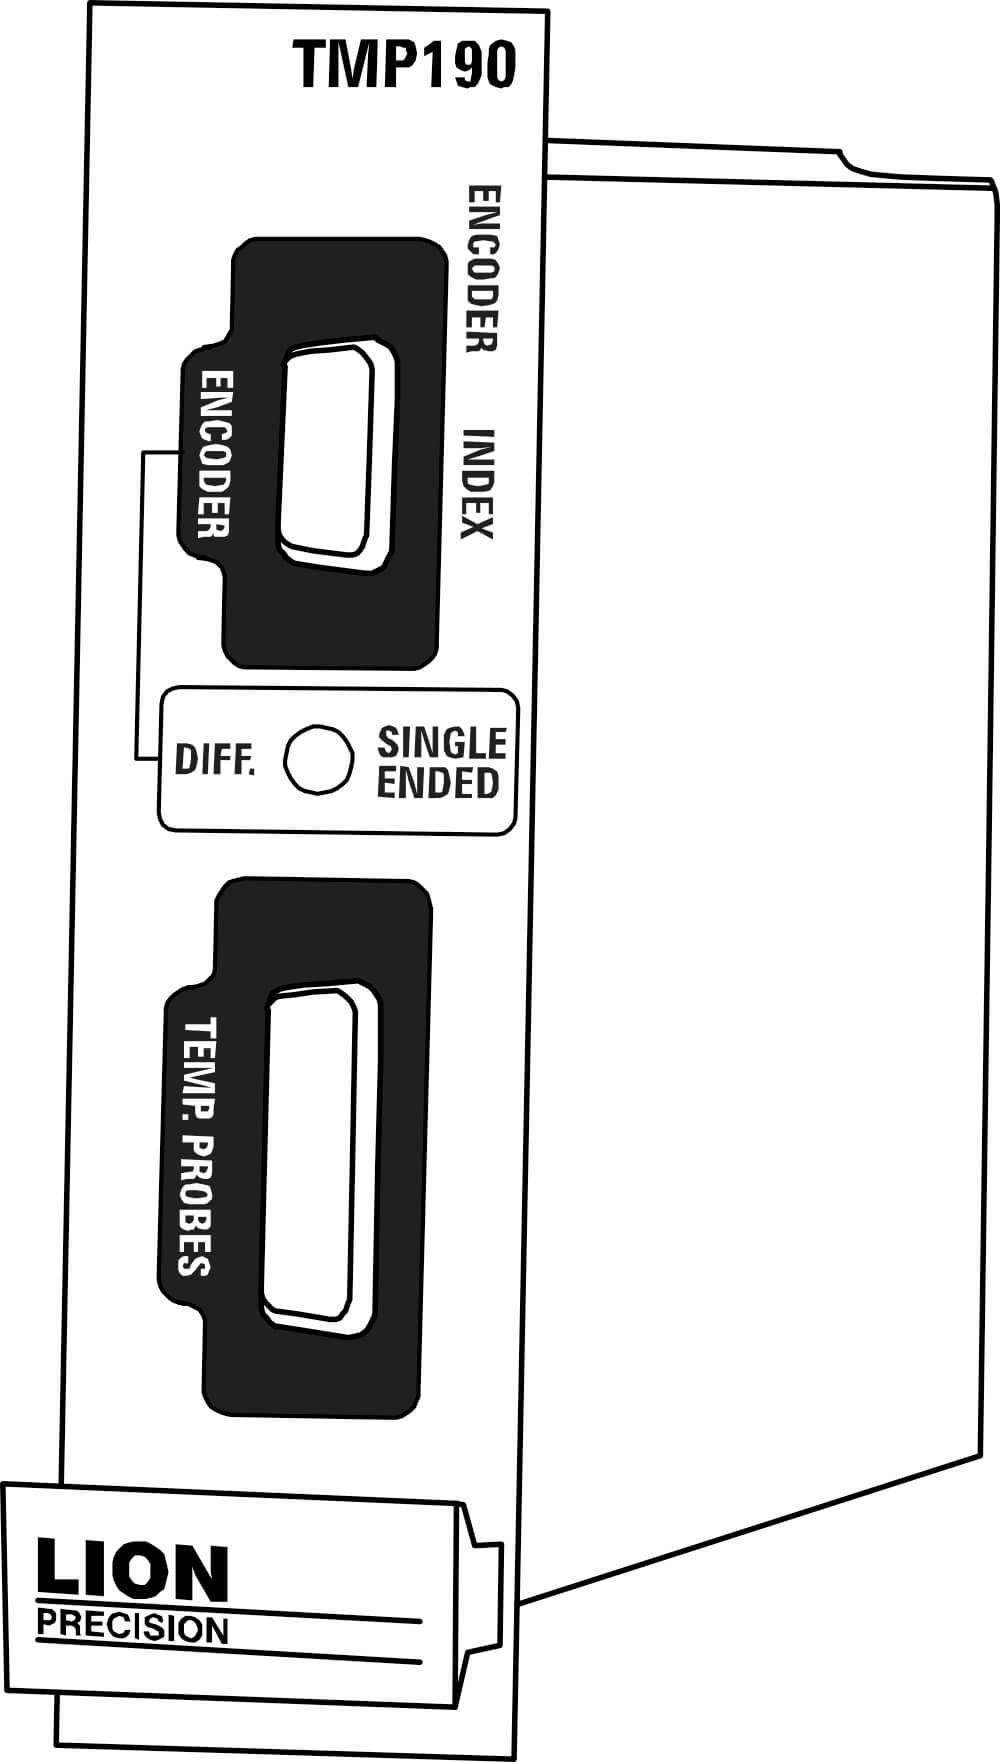
TMP190 Temperature Specifications1
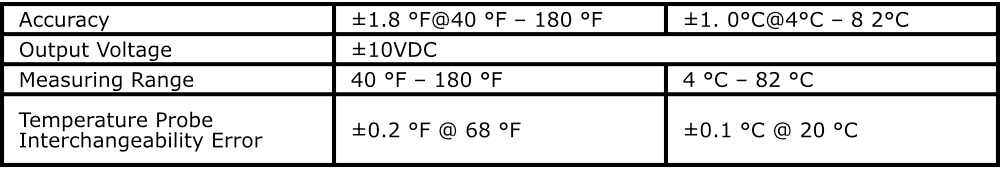
1Shifts as high as 4 °C may occur in high EMI conditions (10 V/m).
Encoder/Index Pulse Input
The TMP190 also processes encoder and index pulse inputs for use by SEA. The module performs basic signal processing on the incoming signal then passes the conditioned signal to the data acquisition hardware for analysis by the software.
By definition, index pulses occur once during each revolution of the spindle. Encoder pulses occur many times per revolution. Both are used to provide angular location information to software during a measurement of a rotating target.
Encoder and Index LEDs
To help verify encoder and index pulse operation, green LEDs indicate activity on the encoder and index inputs by flashing at half the frequency of the corresponding input signal.
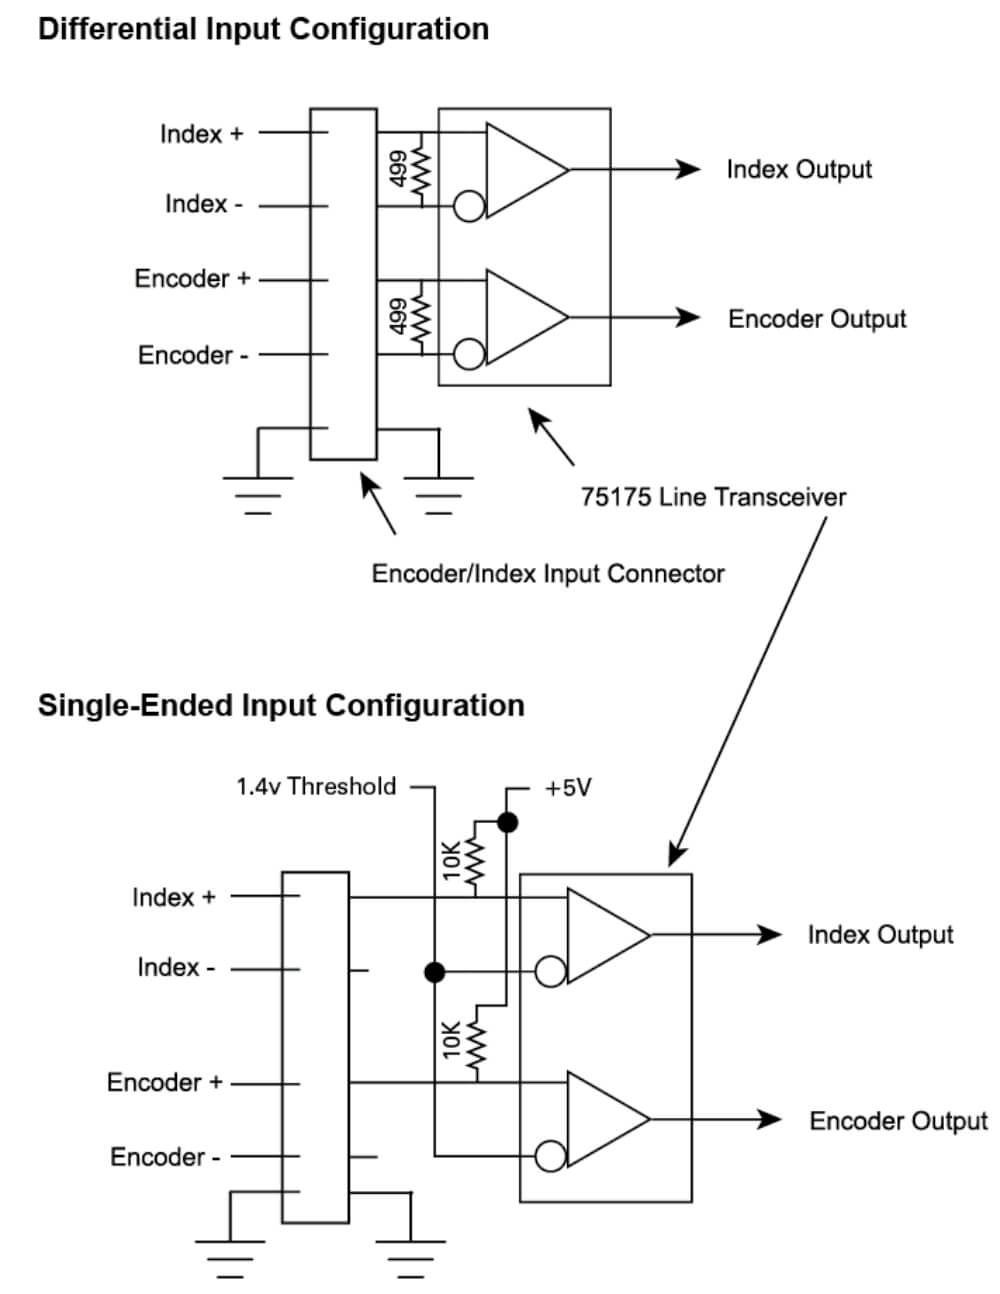
Single-Ended or Differential Inputs
Encoder and index inputs can be configured as single-ended or differential.
In single-ended mode, the signal is measured between the + input and ground. In differential mode, the signal is measured between the + and – inputs.
Differential inputs are less susceptible to noise and interference. The front panel switch selects the operating mode.
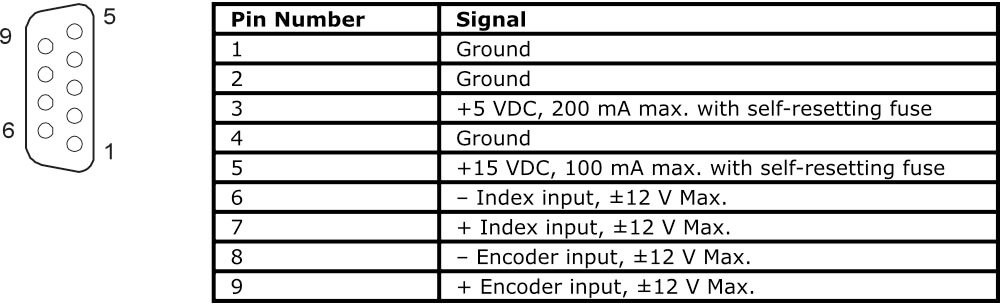
Connections – Encoder/Index
DC power is available on the connector to power encoders or proximity switches.
Block Diagram – Encoder/Index
DC power is available on the connector to power encoders or proximity switches.
To view live test data while a spindle is being measured, select Live Data from the SEA 9 main menu bar.
To view data from saved measurement data, select Open Data File.
Reading and interacting with the test plots and panels in general is covered above. The following sections give specific, unique information about the specific tests.
Basic Tests
Radial: Rotating Sensitive Direction
- Number of Sensors Used: 2
- Default Axes Measured: X, Y
X and Y axis measurements are used to create a polar plot using one of two possible methods:
B89.3.4 (r-theta) or ISO 230-7
Tlusty
The method is selected by View > Method.
Radial: Fixed Sensitive Direction
- Number of Sensors Used: 1
- Default Axis Measured: X or Y
X or Y axis measurements are acquired and presented in a polar plot or a linear plot with angular position on the X-axis.
Select the plot type with View > Polar Plot or Linear Plot. Select axis with View > Channel.
Axial Error Motion
- Number of Sensors Used: 1
- Default Axis Measured: Z
Measures spindle motions in the Z-axis using the probe mounted in the bottom of the probe nest.
Polar and linear plots are available (View > Polar or Linear).
Select View > Display to choose one of two different display options available:
Total – includes error motions at the rotational frequency (fundamental) of the spindle.
Exclude Fund – error motions at the rotational frequency of the spindle (fundamental) are removed from the data before plotting.
The calculated values are not affected by display choice. See the glossary for more information on these display modes.
Tilt: Fixed Sensitive Direction
- Number of Sensors Used: 2
- Axes Measured: X, X2 or Y, Y2
Measurements from both X and X2 (or Y and Y2) channels provide measurements of the synchronous and asynchronous changes in the tilt of the spindle as the spindle rotates. A standard polar plot (tilt angle in μradians) or a 3D plot are available.
Because Tilt measurements only require two probes (in the same axis), two or three channel systems can make Tilt measurements by moving a probe from its original position into the X2 or Y2 position and using View > Channels to select the appropriate channel combination.
Plot type is selected with View > Polar or 3D.
Thermal
- Number of Sensors Used: 1-5, plus up to 7 temperature sensors
- Possible Channel Combinations: Any single channel or tilt combinations (and up to seven temperature sensors)
The two thermal tests listed in international standards are ETVE (Environmental Temperature Variation Error) which is performed while the spindle is stationary, and Thermal Drift which is measured when the spindle is rotating. The display and basic operation of the panel remains the same for both tests. Only the time of the test, the channels used, and the rotation of the spindle are changed.
NOTE
- During the test, measurements are acquired from all channels enabled in DAQ
- Settings. Any channels (displacement or thermal) that are not enabled in DAQ
- Settings, will not record during thermal tests.
Setup
The thermal test setup parameters are accessed by clicking Setup on the Thermal menu bar. Typical test conditions for the two test types:
- Drift Test: Spindle Rotating; 1 hour
- ETVE: Non-Rotating; 24 hours
- Set Test Duration (Hours, Minutes): Sampling frequency is 2 sec/sample for test of 4 hours or less, and 10 sec/sample for tests of more than 4 hours. The sampling frequency is displayed below the duration fields.
- Save Bitmap option: When selected, <filename>.bmp screenshot file will be created. The filename is the same as the specified data file name and saved in the same location.
- Save File Location: Select a file name and location for data storage
Chart Time Axis
Regardless of test duration setting, when a test is started, the chart shows a five minute period so early measurements are easily seen. After five minutes, the display will show the total test duration.
Channel Select Buttons/Displays
Click buttons on the left of the panel to enable/disable display of that displacement (X thru Y2) or temperature channel.
With each click, the Y, Z, X2, and Y2 buttons rotate through Drift/Tilt/Disabled options.
Value displayed on the button is the Range of measurements taken (max-min) for that channel during the test.
Custom Temperature Channel Names
Custom names can be assigned to temperature channels to help identify where the temperature sensors were place. Right-click on a temperature channel button to enter a custom name such as “Air” or “Spindle nose.”
Shift vs. RPM
- Number of Sensors Used: 1-5
- Axes Measured: Any
The axis of rotation of the spindle may shift location with changes in RPM. This test charts any changes in position of the axis of rotation of the spindle against RPM. The operator adjusts RPM and clicks the Save Point button to plot a point.
Clicking the channel buttons will enable/disable the display of that channel.
- Select a starting speed
- Click Save Point
- The position of the spindle in all axes is set as a reference for all other measurements
- Change spindle speed
- Click Save Point
- The difference in spindle position from the reference is charted on the graph
- Repeat steps 4-6 for all desired speeds
Measurements can be taken as the RPM is increased and retaken as the RPM is decreased to display any hysteresis in the RPM/Spindle Position relationship.
Donaldson Reversal
Donaldson Reversal displays data from two Radial – Fixed Sensitive test runs combined in such a way that form errors in the target (out of roundness) are separated from the synchronous error motion of the spindle. The Radial – Fixed Sensitive display must be active in another quadrant during Donaldson Reversal functions.
First measurement:
- Display the Donaldson Reversal panel in one quadrant.
- Display Radial – Fixed Sensitive panel in another quadrant.
- Perform a Radial – Fixed Sensitive measurement.
- Click Store A to store the current Radial – Fixed Sensitive plot in the Donaldson Reversal display.
- Stop the spindle.
Second measurement
- Move the probe to a position 180° around the spindle from its original position.
- Remove and replace the target 180° from its original position in the spindle.
- Perform another Radial – Fixed Sensitive measurement (do not change any settings).
- Click Store B to store the new Radial – Fixed Sensitive plot in the Donaldson Reversal display.
- Click Calculate.
The synchronous error motion of the target and the spindle are plotted independently. Use the display buttons to turn individual plots on and off.
Automated Measurement
Automated Measurement is useful for testing speed-related changes in spindle performance. Measurements are captured each time the spindle speed stabilizes at speeds specified in Automated Measurement Setup.
- NOTE
- Automated Measurement will only run in maximized view (double-right-click the panel or select View > Maximum to enter maximized view).
Selected spindle speeds must be tested in the sequence listed in the panel.
- Maximize the Automated Measurement Panel
- Click Setup on the menu bar to configure the test.
- Choose up to five RPMs to test. A minimum of three values must be specified.
- Select a file name and location for Automated Measurement file storage (required).
- Click Done
- Click Start to initiate the test.
- Set spindle speed to the first RPM (Speeds must be done in order as listed.)
- When spindle speed stabilizes, a measurement will be taken and data written to the table in the appropriate tab at the bottom of the window.
- Repeat steps 7-8 until all listed RPMs have been measured.
View > Automated Test File loads a previously saved test file for viewing. Only SEA 9 files can be viewed. Automated Test files from previous versions cannot be viewed with SEA 9.
Utilities
FFT Frequency Analysis
- Number of Sensors Used 1
- Axes Measured Any
Used to analyze frequency distributions in error motions. The FFT analysis test acquires 64k of sampled amplitude data from a single probe in the time domain and converts the data into the frequency domain. A graph of amplitude vs. frequency is produced. The FFT results on the most recent data set are displayed.
FFT Views (from View menu):
Bar Graph – Bar (column) graph display
Line Graph – Continuous line connecting measurements
Window(from View menu):
Selects the type of mathematical windowing technique for displaying the FFT. Hanning or Rectangular are typical choices.
Scaling
Scaling and axis units are available in the Scaling menu.
Cursor
A cursor (View > Show Cursor Values) can be used display values at any point on the X-axis (frequency). Click and drag the mouse pointer to reposition the cursor or use keyboard arrow keys. For fine adjustment, hold the shift key while using arrow keys.
Center Cursor
Center Cursor will move the FFT cursor to the center of the screen.
Find Peak
Find Peak moves the cursor the highest amplitude point in the FFT. This does not include the 0 Hz (DC) point. This point is merely the DC offset measured from the selected channel and has no bearing on frequency domain measurements.
FFT Data Collection Progress
Collecting 65,536 samples for analysis can take considerable time at lower RPMs and points-per-revolution. Do not save a file until the data collection is complete. A progress count is located in the lower right corner of the chart.
As an example of elapsed time required, at 150 RPM and a sample rate of 100 points per revolution, 4.3 minutes (260 seconds) will be required to collect 65,536 samples. Be sure to verify that FFT data collection is complete before saving the data file if it will be used for later viewing and analysis. If FFT data collection is not complete when the file is saved, no FFT data will be included in the saved file.
Oscilloscope
The Oscilloscope is a utility display that emulates a basic oscilloscope, allowing a time based view of the data acquired on any of the five probe channels.
Use the View menu to select DC or AC Coupling and adjust the plot scales.
Probe Meter
The Probe Meter is an analog meter indicating the current probe/target gap of the selected probe.
The Probe Meter is selected in the Top Menu Bar.
Any one of the five probe channels can be displayed. Use the mouse or the up or down keyboard arrows to select a different channel.
If the measurement is out of range, red “over range” text will appear on the meter.
Maximum and minimum indicators retain the maximum and minimum positions of the meter needle.These values are shown digitally below the meter. Click the Refresh TIR button to reset the maximum and minimum indicators to the current meter indication.
To save rotating spindle test data, click Save Data File in the Top Menu Bar. This will immediately pause data collection (menu bar turns yellow and all panels freeze at current values). This provides a steady data set to save.
A typical Windows dialog box is presented to select an existing or create a new file.
Thermal, Shift vs. RPM, Automated Test, and Donaldson Reversal test files are saved by selecting View > Save File from their corresponding panels.
Print screen offers three options for printing the current screen:
Print Preview: Displays a print preview screen from which you select to print to an existing printer
Send to Printer: Sends the current screen to an existing printer
Print to PDF: Displays a Save As dialog box to select the name and location to save a PDF of the current screen.
APPENDICES
Quadrant menus will contain different options depending on the displayed panel. All possible menu items are listed below, but they will not all appear on every panel.
Display
Lists all possible panels for display.
View
View > Maximum Size enlarges a quadrant panel to full screen.
View > Normal Size reduces a full-screen panel to a quadrant.
View > Polar Plot provides a polar plot of the error motion.
View > Linear Plot provides a linear plot of the error motion with degrees of rotation as the chart’s X-axis and error as the chart’s Y-axis.
View > Plot Type > Total all spindle motions including motions occurring at the rotational speed of the spindle.
View > Plot Type > Exclude Fund removes motions occurring at the rotational speed of the spindle (fundamental).
View > Circles > Total [F3] draws the maximum and minimum value circles on the graph in blue.
View > Circles > Average [F4] draws the average value plot on the graph in green.
View > Revolutions > Individual [F6] displays the first revolution. Subsequent selections of this menu item will display subsequent revolutions. The displayed revolution number is indicated in the lower right of the graph. Primarily intended for use while viewing saved files.
View > Revolutions > All [ESC] displays all the revolutions.
View > Channel allows the selection of X, Y, Z, X2, or Y2. X is the default. Selecting other channels is only meaningful if probes are connected to those channels and channels are enabled in DAQ Settings.
Setup
Some tests require specific setup information not included in the Settings screens. Clicking the Setup menu item immediately displays a dialog box for setting test parameters.
Scaling
Scaling > Rescale [Enter] when in manual scaling mode, scales the current data to fit the plot area.
Scaling > Auto [End] monitors the data and changes the scale so that the data is always within 40% to 90% of the scale. Auto-scaling can also be activated by clicking the END key while the quadrant is active.
Scaling > Manual > Increase [PgUp] or Decrease [PgDn] deactivates auto-scaling and increases or decreases the graph scale.
GLOSSARY
Many of the definitions here are taken from ASME B89.3.4-2010: Axes of Rotation: Methods for Specifying and Testing.
Asynchronous error motion – the portion of the total error motion that occurs at frequencies other than integer multiples of the rotation frequency. Asynchronous error motion comprises those components of error motion that are: (a) not periodic (b)periodic but occur at frequencies other than the spindle rotational frequency and its integer multiples, (c) periodic at frequencies that are subharmonics of the spindle rotational frequency.
Asynchronous error motion value – the maximum scaled width of the asynchronous error motion polar plot, measured along a radial line through polar chart center.
Axial error motion – error motion coaxial with the Z reference axis. Axial slip, end-camming, pistoning and drunkenness are common but inexact terms for axial error motion.
Axial thermal drift – applicable when the displacement is collinear with the Z reference axis.
Axis average line – a line segment passing through two axially separated radial motion polar profile centers. The axis average line is used to describe the unambiguous location of an axis of rotation with respect to the reference coordinate axes, or changes in the location, for example, in response to changes in load, temperature or speed.
Axis of rotation – a line segment about which rotation occurs
Axis shift – a change in position of the axis of rotation caused by a change in operating conditions.
Bearing – an element of a spindle that supports the rotor and allows rotation between the rotor and the stator.
Displacement indicator – a device that measures displacement between two specified objects.
Error motion – changes in position, relative to the reference coordinate axes, of the surface of a perfect workpiece, as a function of rotation angle, with the workpiece centerline coincident with the axis of rotation.
Face error motion – the sum of the axial error motion and the axial component of tilt motion at the specified radius. Face error motion is parallel to the Z reference axis at a specified radial location. The term “face runout” has an accepted meaning analogous to radial runout and hence is not equivalent to face error motion.
Face thermal drift – applicable to a combination of axial and tilt displacement measured at a specified radial location.
Fixed sensitive direction – the sensitive direction is fixed when the workpiece is rotated by the spindle and the point of machining or measurement is not rotating.
Fundamental error motion – that portion of the total error motion that occurs at the rotational frequency of the spindle. Fundamental axial and fundamental face motions are error motions and cause flatness errors on parts. However, fundamental error motion will create a part with the property of circular flatness: The surface is flat and will provide a “sealing surface” at any given radius. This unique property is important to the hydraulic industry. Fundamental radial and fundamental tilt displacements are not error motions because they represent misalignment of the artifact, not a property of the axis of rotation. Fundamental axial and fundamental face motions are error motions and have important engineering consequences.
Fundamental error motion value – twice the scaled distance between the PC center and a specified polar profile center of the synchronous error motion polar plot. Alternatively defined as the amplitude of the rotational frequency component. The value is twice the amplitude because, in this case, amplitude represents the average-to-peak value rather than the peak-to-peak value. Fundamental axial value and fundamental face value are the same value. There is no fundamental radial error motion value – in the radial direction, motion that occurs at the rotational frequency is caused by an off-center reference target and is not a property of the axis of rotation.
Least squares circle (LSC) center – the center of a circle which minimizes the sum of the squares of a sufficient number of equally spaced radial deviations measured from it to the error motion polar plot.
Nonsensitive direction – is any direction perpendicular to the sensitive direction.
Perfect spindle – a spindle having no motion of its axis of rotation relative to the reference coordinate axes.
Perfect workpiece – a rigid body having a perfect surface of revolution about a center line
Radial error motion – error motion in a direction perpendicular to the Z reference axis and at a specified axial location.
The term “radial runout” has an accepted meaning which includes errors due to centering and workpiece out-of-roundness and hence is not equivalent to radial error motion.
Radial thermal drift – applicable when the displacement is perpendicular to the Z reference axis.
Residual synchronous error motion – the portion of the axial and face synchronous error motion that occurs at integer multiples of the rotation frequency other than the fundamental. Residual synchronous and synchronous error motions are mathematically identical. These type of errors cause flatness errors on the face of turned parts.
Residual synchronous error motion value – the scaled difference In radii of two concentric circles from a specified error motion center just sufficient to contain the residual synchronous error motion polar plot.
Rotating sensitive direction – the sensitive direction is rotating when the workpiece is fixed and the point of machining or measurement rotates.
Rotor – the rotating element of a spindle.
Runout – the total displacement measured by a displacement indicator sensing against a moving surface or moved with respect to a fixed surface. The terms “T.I.R.” (total indicator reading) and “F.I.M.” (full indicator movement) are equivalent to runout. Surfaces have runout; axes of rotation have error motion. Runout includes errors due to centering and workpiece form errors and hence is not equivalent to error motion.
Sensitive direction – the sensitive direction is perpendicular to the perfect workpiece surface through the instantaneous point of machining or measurement
Spindle – a device which provides an axis of rotation.
Stator – the stationary element of a spindle.
Stator – to-rotor error motion – generic term for any error motion associated with a spindle measured between the ends of a minimal structural loop.
Structural error motion – error motion due to internal or external excitation and affected by elasticity, mass, and damping of the structural loop.
Structural loop – the assembly of components which maintain the relative position between two specified objects.
Synchronous error motion – the components of total error motion that occur at integer multiples of the rotation frequency. The term average error motion is equivalent but no longer preferred. The method of averaging described in B89.3.4 Fig A11 remains acceptable for the determination of synchronous error motion.
Synchronous error motion value – the scaled difference in radii of two concentric circles from a specified error motion center just sufficient to contain the synchronous error motion polar plot.
Thermal drift – a changing distance or angle between two objects associated with a changing temperature distribution within the structural loop.
Thermal drift plot – a time-based record of thermal drift.
Thermal drift value – the difference between the maximum and minimum values over a specified period of time and under specified conditions.
Tilt error motion – error motion in an angular direction relative to the Z reference axis. Coning, wobble, swash, tumbling and towering errors are common but inexact terms for tilt error motion.
Tilt thermal drift – applicable to a tilt displacement relative to the Z reference axis.
Total error motion – the complete error motion as recorded.
Total error motion value – the scaled difference in radii of two concentric circles from a specified error motion center just sufficient to contain the total error motion polar plot.
SOFTWARE LICENSE AGREEMENT
By receipt and use of this LION PRECISION product you, the end user, and LION PRECISION agree to and are bound by the terms of this license agreement. If the terms of the agreement are not acceptable to you, return the product to LION PRECISION for full credit. The terms of the agreement are as follows:
1. GRANT OF LICENSE. In consideration of payment of license fee, which is a part of the purchase price of this product Lion Precision grants you, the LICENSEE, nonexclusive rights to use the included Lion Precision software on a single computer at any one moment in time.
2. OWNERSHIP OF SOFTWARE. As the LICENSEE, you own the media upon which any Lion Precision software is stored but Lion Precision retains title and ownership of the software recorded on the original media as well as all subsequent copies of the software. This license IS NOT a sale of the original software. Only the right to use it.
3. COPY RESTRICTIONS. This software and the accompanying written materials are copyrighted. Unauthorized copying or modifying of this software is strictly forbidden. You may be held legally responsible for any copyright infringement or encouraged by your failure to abide by this agreement. Subject to these restrictions, the LICENSEE may make two (2) copies for backup purposes only. LICENSEE takes full responsibility for the use, and or any distribution of, any copied software according to this license agreement.
4. USE RESTRICTION. As the LICENSEE you may transfer the software from one computer to another, provided the software is used on only one computer at any one time. You may not electronically transfer the software over any network or bulletin board service. You may not distribute this software or accompanying written materials to others. You may not modify, translate, reverse engineer, decompile, or disassemble the software.
5. UPDATE POLICY. Lion Precision may create, from time to time, updated versions of the software. At its option, Lion Precision will make such updates available to the LICENSEE.