Hardware
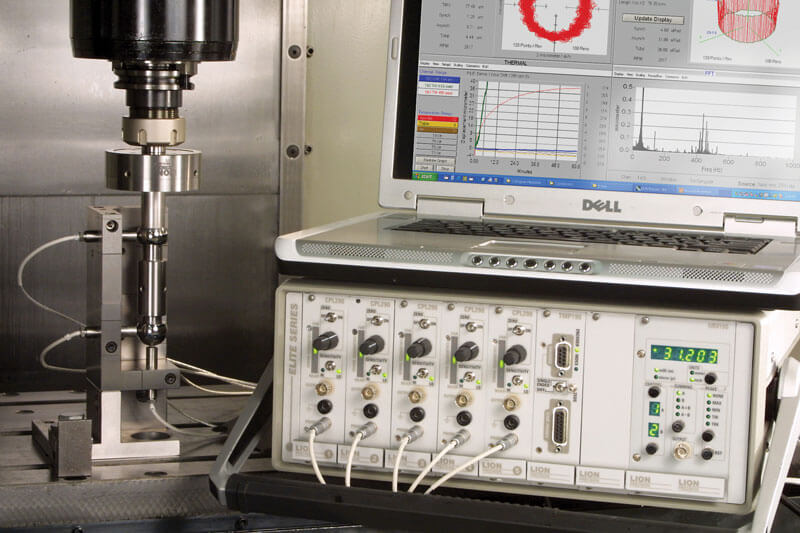
The Spindle Error Analyzer features the Elite Series of high-performance capacitive sensors. These sensors provide a dual-sensitivity option, nanometer resolutions, and optional temperature modules. One cable connects the sensors to the software which reads all of the calibration data directly with no need for operator data entry. Precision master-ball targets, with nanometer roundness, mount directly in tool holders and lathe chucks. Probe mounts secure the capacitive probes at precise locations for reliable results. Up to seven temperature sensors enable you to understand how your machine changes with temperature at multiple locations: ambient, spindle, frame, table, etc.
Software
The Spindle Error Analyzer software collects data from the sensors, calculates error motions, and displays numerical and graphical results. Up to four test windows can be viewed simultaneously, or any test window can be viewed full screen. Test data can be archived for later viewing and comparison with future tests. The software includes windows for configuration, photos, probe setup, and system diagnostics; a complete on-screen help system is included.
The Spindle Error Analyzer performs tests in compliance with these standards:
ANSI/ASME Standard B5.54-2005: “Methods for Performance Evaluation of CNC Machining Centers”
ISO230: Test Code for Machine Tools, 3:“Determination of Thermal Effects“ 7:“Geometric Accuracy of Axes of Rotation”
ANSI/ASME B5.57-1998: “Methods for Performance Evaluation of CNC Turning Centers“
ANSI/ASME B89.3.4: “Axes of Rotation, Methods for Specifying and Testing“
Measuring Performance
 Precision Sensors and Targets
High-performance, noncontact capacitive probes mounted in a nest measure the dynamic displacement of precision master ball targets mounted in the spindle tool holder or lathe chuck.
Five Axes of Measurement
A probe is mounted to measure displacement in the Z axis. A pair of probes are mounted 90° apart (top view) to measure movement in the X and Y axes. A second pair of X and Y probes are mounted to measure a second master ball. The combination of X and Y probe pairs generates tilt measurements.
Analysis and Display
Proprietary software collects readings from the probes while the spindle is
turning, analyzes the results, and reports them on screen with numerical measurement values and polar or linear plots.
Measurements and Listed Values:
- Rotating Sensitive Radial
- Fixed Sensitive Radial
- Radial Tilt
- Axial
- Thermal Growth
- FFT
- Automated Testing
- Synchronous error
- Asynchronous error
- X and Y Axis TIRs
- Thermal Growth
- Tilt
- Spindle Shift with RPM
Rotating Sensitive Radial
 Rotating Sensitive Radial acquires displacement data from two probes positioned 90° apart. The probes measure the X and Y displacement of the axis of rotation to generate a polar plot. Rotating Sensitive Radial tests are valid for processes such as milling, boring, and drilling, where the tool is rotating in the spindle.
Fixed Sensitive Radial
 Fixed Sensitive Radial acquires displacement in the X direction relative to spindle angular location and displays the data in a polar plot. Fixed Sensitive Radial tests are valid for processes such as turning and some grinding processes where the part is rotating in the spindle, or where the point of contact between the grinding wheel and part are at a fixed position such as surface grinding.
Tilt – Fixed Sensitive
 Using a probe pair in the X axis or Y axis, spindle tilt is measured and displayed at different angular locations. Display either standard polar plots or 3D plots. The test allows prediction of performance at any location along the spindle axis. Tilt measurements indicate the increase in error sources as the workpiece or tool are extended farther from the spindle face.
Axial
 Axial Error Motion acquires displacement data from one probe in the Z axis. The probe measures the axial displacement of the spindle. Spindle angular location data is also required which is obtained from the eccentricity measured by another probe in the X or Y axis or an index or encoder signal. In addition to a polar plot, axial error motion can also be displayed in a linear, oscilloscope type display.
FFT
 The FFT analysis test acquires data from a single probe and displays the relative amplitude of its frequency components. A graph of amplitude vs. frequency is produced. The graph is updated once per second, showing the FFT results on the most recent data set. FFT data is used in identifying bearing frequencies, resonant frequencies, harmonics, RPM, and structural vibration.
Temperature Stability
 Stability tests measure the effects of heat produced by the spindle itself during operation. These short-duration tests are performed while the spindle is rotating. This measures changes in relative position between the tool and workpiece which affect machine tool performance, such as: location of features on a part at any distance from the spindle face, location of a hole, depth of a hole, location of a contour. The test also isolates simple X and Y motion from more complex tilt motions.
Temperature Variation Error (TVE)
TVE tests for movement of the tool relative to the workpiece due to ambient temperature changes. This test is performed without spindle rotation and with power to the machine turned off. Because of the slow changing nature of ambient temperature and the time required for the thermal mass of a machine tool to “soak out” to the ambient temperature, these tests are of long duration with twenty-four hours being typical. This measurement is performed with probes in the X, Y, and Z axes.
Automated Testing
Generate a spreadsheet of consecutive test runs. Check performance over time or at different spindle speeds. Information can be linked to an Excel spreadsheet for later graphing, printing, sharing, and custom analysis.
Radial Performance Parameters
- Roundness capability due to synchronous spindle error motion.
- Surface finish capability due to asynchronous spindle error motion
- Performance degradation atspecific speeds
Related Source Problems
- Out of round bearing races
- Out of round bearing seats
- Misaligned bearing seats
- Bearing wear, Improper preload, Structural vibration
- Inadequate stiffness, Imbalance, Resonant frequencies of machine
Axial Performance Parameters
- Surface finish capability due to asynchronous spindle error motion.
- Performance degradation at specific speeds.
Related Source Problems
- Bearing wear, Improper preload Structural vibration.
- Inadequate stiffness, Imbalance Resonant frequencies of machine.
Expert Opinion
“Troubleshooting by simply looking at unsatisfactory and out-of-tolerance parts is difficult at best. The use of proper measurement tools provides the quickest and most accurate path to identifying causes and solving problems.”
Eric Marsh Ph.D.
Machine Dynamics Research Lab
Penn State
“Routinely measure machines in your shop to know their health and condition before they make bad parts, before they breakdown. That’s the great advantage – to be in command of your destiny – to be able to direct the machines to do what you want them to do.”
James Bryan Ph.D.
Precision Engineering Specialist
Formerly of Lawrence Livermore National Laboratories
“They wouldn’t need a tenth of those inspection rooms at the other end and they’d make parts right the first time.”
Robert Hocken Ph.D.
Head of Precision Engineering
UNC Charlotte